Insight, analysis & opinion from Joe Paduda

May
20

2018 Work Comp results – key takeaways part 2 – the details

NCCI Chief Actuary Kathy Antonello’s presentation on the state of the industry has just too much information for a single post – so here’s three key details.

Reserves

Private carriers are over-reserved. That means there’s several billion dollars of excess cash on carrier books. I’d note that this ASSUMES the projections are accurate, and that losses for already-incurred claims don’t get worse (or, in insurance-speak, develop upward).

Frequency

Lost time claim frequency declined by 1 percent last year – significantly less than we’ve seen over the decade. My take is this is related to several factors.

  • Employers aren’t focusing on work comp issues – e.g. safety and loss prevention – as premiums are so low that they aren’t a problem.
  • Hiring standards have been relaxed as we’re at full employment
  • More overtime is being worked, leading to higher injuries due to tired workers

Severity

Medical costs went up a mere 1 percent in 2018, continuing a trend of relatively low increases that’s persisted since 2008 (the jump of 4.1% in 2017 looks like an aberration).

What does this mean for you?

Workers’ comp is not a problem for employers – which means it will get little attention from legislators.

When buyers aren’t experiencing pain, they have little reason to buy.


May
15

NCCI AIS 2019 – Quick Takes

This year’s Annual Issues Symposium was the best I’ve attended – and I’ve been to 20 or so.

The hotel and conference center were excellent – great service, everything was right on site, food was very good, all around best conference site experience in memory.

The opening day’s content was rich and mostly very well done. Kathy Antonello’s discussion of results continues to improve. I would have liked a bit deeper dive into cost drivers, but that’s a very minor quibble; you can’t cover everything in an hour. Graphic presentation was helpful, and Kathy is clearly comfortable on stage and enjoys presenting.

For me, after Kathy’s State of the Line the highlight was the discussion of AI and human decision making. Jim Guszcza of Deloitte was brilliant, laying out a compelling case for the joint use of both AI and humans in decision making.

A discussion of TRIA renewal was – I’m sure – of keen interest to many, but the speaker’s impact suffered a bit as he read his talk.  David Priebe of Guy Carpenter is clearly expert in all things TRIA and knows his stuff.

Moments into David Deitz’ physician panel, the hotel lost power and all went dark.  Staff responded quickly, using social media to keep all of us informed – they handled the unexpected with aplomb.

The physician panel is up there somewhere…

When things got started, I had the sense the blackout was a metaphor for payers’ views of treating providers – there’s little visibility into what docs have to deal with when serving work comp patients.

In fact, the physicians had pointed comments about the problems docs face trying to do the right thing, many of which are caused by well-intentioned but ultimately dumb “requirements”. Takeaway – if we want good care, we need to make sure the people delivering it like to work with us. We have a long way to go to make the occ docs who care for our patients true partners.

Barry Lipton quickly ran thru three research foci, I particularly liked Barry’s insights into ways work comp and group health are different.

Alas I won’t be attending the second day; the boy’s annual mountain bike trip conflicted.  It’s off to Moab, Utah, for four days of back-to-boyhood.

What does this mean for you?

This is a must go. Sign up early so you don’t get locked out of 2020.


May
14

Work comp – the physicians’ view

Dr David Deitz moderated a panel of physicians tasked with describing the role of primary care in workers’ comp. Ed Bernacki, Jill Rosenthal of Zenith, and Will Gaines of Baylor Scott&White Health participated.

The takeaways –

  • Primary care for occupational injuries which will evolve significantly over the next few years due to retirement of physicians, telemedicine and physician extenders.
  • Most physicians never get any training in occupational medicine (I know, shocker) – therefore it’s no surprise communications with treaters can be frustrating and care management contentious at times.
  • Hospital consolidation is affecting patient care, and direction of patients to the best provider can be hampered/interfered with if treating docs are required by their health system to refer to other providers in that system.
  • Measurement of “performance” and “quality” is different for occ docs; we care about long-term outcomes and functional ability. Not enough payers are actually sharing scorecards/outcome reports with treating providers, and those who are aren’t doing much in the way of follow-thru to discuss results and ways to improve.
  • Electronic Medical Record technology tends to be menu-driven, click-thru, or voice recognition  – all of which are inadequate at best.  Dr Gaines estimated EMR adds 90-105 minutes EVERY DAY to his workload. Not reimburseable, too.
    • Oh, and the doc is often looking at the computer or screen – not at the patient.
    • The EMR yet one more factor making primary care a less and less attractive specialty for new physicians. They just don’t want to deal with all that friction.


May
14
  • Direct written premium was flat,
  • combined ratio stayed low,
  • loss costs decrease, and
  • reserve deficiencies disappeared.

Later this week I’m going to do a series of posts unpacking these findings and opining on what it means for you. For now, here are the key takeaways

The big number – the combined ratio – got a lot better – declining to 83 from 2017’s 89. That is a historically low number.

Here’s the entire presentation.

We’ll focus on indemnity and medical expenses for a moment, as these are key cost drivers. Note that these data are ONLY for NCCI states – which don’t include some big states such as New York.

The graph below shows that indemnity claim severity – the cost per claims did increase – albeit modestly.

Medical costs barely increased last year. I’ll have a lot more to say about this in a future post.

Kathy does an excellent job making really complex data understandable while making it relevant.

For example, payroll increased by 5.3% in 2018, more than offset by total loss costs (driven by frequency and claim costs) which dropped almost 9%. The takeaway – claim costs decreases are more than offsetting increases in payroll and employment. That happened despite a big increase in employment in construction, which is a higher frequency, higher severity industry.

The result, only 5 percent of surveyed respondents saw an increase in their WC premium rate this year; almost everyone had no increase or a decline.

Let’s pause here.

This has never happened in workers’ comp. We have never seen this level of financial performance, and it is clear insurers are still trying to figure out why this is happening, when it will end, what will cause a change, and what the warning signs will be.

What does this mean for you?

Life is pretty great right now. We do know it will end.  We do NOT know what will cause that event.


May
13

Explaining pharmacy pricing, part 4

Do you have any idea if you are paying your PBM what you should?

Work comp payers’ PBM pricing is based on AWP; typically it is a percentage below AWP. Brand drugs are discounted 10-16%, and generic pricing is typically below AWP -40% .

The PBM is making its money on the “spread”; the difference between what it pays the pharmacy, and what it charges you.

Your PBM contracts with retail pharmacies, chains, food and drug purveyors (think Walmart), and independent pharmacies. In some cases third party billers are also contracted, along with physician dispensers and mail order pharmacies.

Here’s where it gets funky.

The PBM’s contracted rates with those pharmacies are all over the place and may even vary by region or drug. That’s fine; you are getting a discount, and the PBM is betting it will – overall – make a profit.

That is, it’s fine IF your average discount is equal to or better than what you were promised.

Reality is, very few workers’ comp payers review their PBM’s bills to make sure that the average discount is what they were promised. 

Workers’ comp insurers and TPAs audit claims, case management performance, reserves, bill review, hospital bills, network discounts, legal bills…pretty much everything BUT pharmacy.

The Russians said it best.

That is NOT to say PBMs purposely mess with the numbers/bills/codes to increase their reimbursement. Rather, like any entity, mistakes can be made, lapses occur, updates lag.

Unfortunately, in the audits we’ve seen these errors usually benefit the PBM.

What does this mean for you?

If you’re looking to ensure you’re paying what you should, let’s talk.


May
10

Explaining pharmacy pricing, part 3

Here’s the thing about “list” prices for drugs – the more accurate definition of AWP is “Ain’t What’s Paid.”

The REAL price is what is paid AFTER rebates and other discounts are applied.

That’s why the current media frenzy over drug prices is just dumb; it doesn’t account for the impact of rebates on the actual price you pay.

Reality is, actual prices paid for brand drugs went up by a measly 0.3% in 2018. Consumers benefited from rebate sharing as well, as the average price they paid for brand drugs didn’t go up last year.

That said, the fastest growing part of drug spend is specialty medications, drugs that are injected or for critical diseases such as cancer, hepatitis C, HIV, and autoimmune diseases.

Specialty medications only accounted for 2.2% of all prescriptions, but almost half of total drug spend.

What does this mean for you?

  • Across the board, drug price increases are negligible…for those payers that capture rebates.
  • Rebates are key – if you are not capturing rebates, the price you pay for brand drugs is much higher than it could/should be.
  • Pay very close attention to specialty meds.

IQVIA has an excellent and quite detailed report on drug price and utilization trends – available here.


May
9

Explaining pharmacy pricing, part 2

Yesterday was post 2 of Pharmacy Week at MCM, an intro to drug pricing. Today we’ll get you up to speed on why the list prices for drugs are irrelevant – mostly. 

Recall that almost all work comp drug fee schedules are based on Average Wholesale Price – a metric that is three falsehoods in one, as it is neither “average”, “wholesale”, or the “price”.  Regardless, when calculating the “savings” from a PBM contract, buyers almost always use AWP as the baseline. And that’s what buyers report to their bosses and customers; here’s what we saved below states’ fee schedules…

As we discussed yesterday, brand drug manufacturers pay PBMs (and other entities in the drug supply chain) rebates on their drugs so the PBMs will allow patients to get those drugs without going thru the Prior Authorization process.

That’s quite effective in the commercial health insurance world, where insurers have complete control on what drugs are “on formulary” and drive consumer behavior by setting co-pay amounts. It’s a lot less effective in work comp, where formularies are driven by a) state regulations and/or b) treatment guidelines. In either case, work comp payers can’t encourage patients to use preferred brand drugs by setting the co-pay lower than non-preferred brand drugs.

That’s not to say work comp PBMs don’t get paid rebates for brand drugs – in many cases they do, although the amounts can be a lot lower for comp.  And, PBMs often, and with some justification, use these rebates to offset price reductions.

You’re wondering: “well, how many dollars are we talking about?” I’ve heard different things from different people, from an average of $35 per brand script to $74.  Or, in percentage terms, up to 30%. Those payments aren’t for ALL brand drugs, and it’s highly likely the manufacturers don’t even know they are sending those dollars to work comp PBMs and payers; Work comp is such a tiny piece of total drug spend that most entities don’t bother to track it.

What does this mean for you?

Rebates are being paid to work comp PBMs and payers. Some payers don’t want the rebate payments; they’re afraid those payments could be construed as affecting decisions about medical treatment.

Others look at this as a fiduciary responsibility issue; they want to know so they can better manage their customers’ dollars.


May
8

Explaining pharmacy pricing, part 1

With all the attention being paid to pharmacy prices, it’s time we dug deep into  PBM pricing, rebates, and what this all means to you.

We’ve learned from all the lawsuits, Congressional hearings, media blitzes and punditry is that this is everyone else’s fault.

We’ve heard that Ohio is suing Optum over alleged improprieties related to the state’s work comp and Medicaid pharmacy programs [to be clear, Optum’s Ohio work comp problems arose from Optum’s acquisition of Catamaran, which served BWC. The ensuing debacle was not due to Optum’s work comp PBM.]

We’ve heard testimony before Congress that it’s the manufacturers’ fault, the PBMs’ fault, the gubmint’s fault, employers’ fault.

To unpack the issue we have to begin with the list price of drugs vs the actual price.

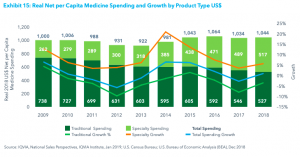
And we have to separate brand drugs vs generics;  most of the press about prices pertains to brand drugs. These are medications that are still covered by patents; only the patent holder can sell the drug, and they can set any price they want. In work comp, brand drugs account for about 15% of scripts, but a bit over half of total drug costs; as the manufacturer has monopoly pricing power, that’s not surprising.

(Generics are drugs that have lost patent protection and can be made and sold by any FDA-approved manufacturer.)

In work comp, most states with fee schedules use “Average Wholesale Price”, a metric that is published by several entities- Medispan is one of the more common. It’s critical to understand that AWP is NOT the real “average wholesale price”, it is merely the price the manufacturer sent to Medispan et al. There’s no checking, auditing, or verification of this price by any outside entity; there’s no independent confirmation that the manufacturer’s AWP is what it charges for the pill.

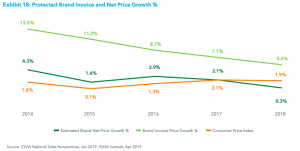
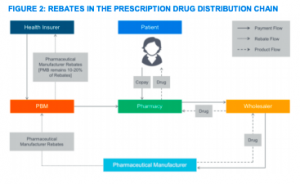
To estimate the actual price, one has to factor in rebates and other financial mechanisms used by manufacturers to market their drugs. Rebates are paid to Pharmacy Benefit Managers – that then pass most of the rebate $$ along to employers and insurers – to encourage the PBM to “put the drug on formulary.” In English, that means the PBM makes it easy and cheap for you, the consumer, to get that medication.

source – Milliman

If a medication is not on a preferred formulary, it will cost a lot more, and you have to go thru the “prior authorization” process to get approval for it.

Clearly manufacturers are highly motivated to get their drugs “on formulary” – and they use rebates to incent PBMs, insurers, and employers to do just that.

So, when calculating the price of the pill, one has to factor in the rebate paid to the PBM/insurer/employer to get to the TRUE price – which is usually a lot less than the published AWP price.

Tomorrow, what this actually looks like – and a few more pricing definitions.

What does this mean for you?

Rebates are critical to understanding pharmacy pricing.


May
6

It’s work comp pharmacy week at MCM

And to kick it off, here are quick facts about work comp pharmacy…

Total workers’ comp drug spend was about $4 billion last year.  Others will argue it’s much higher, after 15 years of digging into the data I’m quite comfortable that figure is accurate.

That’s about 13% of total work comp medical spend  of $31 billion (using NASI’s industry-standard report as the source).

Work comp drug spend has been steadily – and significantly – decreasing for the last eight+ years; my best estimate is drug costs are down about $1.1 billion since 2010.

This remarkable drop has been driven by dramatic decreases in opioid usage and fee schedule changes; PBM consolidation has also been a driver as PBM pricing has declined over the last several years.

Today there are two major WC PBMs, two mid-tier ones, and a host of much smaller companies with little market share.

In 2017, opioid spend declined to less than a quarter of total drug costs, driven by a 30% drop over the previous two years. The even-better news is patients not taking opioids also don’t need to take drugs to mitigate the side effects; insomnia, depression, constipation, erectile dysfunction, etc. And, the knock-on effects on claim duration and settlements are positive indeed.

You can download CompPharma’s latest PBM in WC report here,  all of our 15 surveys are available here.

Tomorrow we’ll dig into pricing and what’s real – and what isn’t – in the media’s coverage of drug pricing.


May
2

The CBO’s Single Payer Report and worker’s comp

The CBO’s 34-page analysis of Single Payer is out, and there are no references to workers’ comp or occupational injuries/illnesses. 

That doesn’t mean there aren’t plenty of ways Single Payer would affect work comp.

Briefly, Single Payer is a very broad term that over-generalizes a bunch of very different approaches to universal health insurance coverage. As defined in the CBO report, in Single Payer programs “people enroll in a health plan operated by the government, and the receipts and expenditures associated with the plan appear in the government’s budget.”

When you recall that work comp accounts for about 1% of total US medical spend, it’s no wonder the CBO report ignores us. But, how Single Payer would affect comp depends on two core issues:

  • whether care for occupational injuries/illnesses is covered by Single Payer, and
  • whether there is a universal fee schedule.

If WC care is included under Single Payer, it is likely work comp would evolve to an indemnity-only system. This currently exists in several other countries, and seems to work pretty well.

If WC medical care is NOT included in Single Payer, the impact would be driven largely by the presence – or absence – of a universal fee schedule. 

Without that universal fee schedule, providers would likely continue to do their revenue maximization thing, although they’d supercharge those efforts. Why? Because reimbursement from all other payers would drop significantly, and providers would look to comp to replace as much of that lost income as possible.

What does this mean for you?

The healthcare system is the elephant, and workers’ comp is the mouse.


Joe Paduda is the principal of Health Strategy Associates

SUBSCRIBE BY EMAIL

SEARCH THIS SITE

A national consulting firm specializing in managed care for workers’ compensation, group health and auto, and health care cost containment. We serve insurers, employers and health care providers.


DISCLAIMER

© Joe Paduda 2024. We encourage links to any material on this page. Fair use excerpts of material written by Joe Paduda may be used with attribution to Joe Paduda, Managed Care Matters.

Note: Some material on this page may be excerpted from other sources. In such cases, copyright is retained by the respective authors of those sources.

ARCHIVES

Archives