I spend a lot of time in the weeds, digging into
- facility reimbursement details,
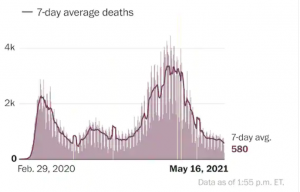
- evaluating COVID infection rate studies,
- identifying new work comp scams,
- figuring out if WC claims will increase,
- railing at insurers and TPAs that aren’t doing what they should be,
- studying the impact of pharmacy on work comp claim reserves and
- all manner of other minutiae.
That’s all well and good, but I tend to lose track of the big picture – in this case – what’s really going on in medical management these days, why, does that make sense, and what does the future hold?
So here’s where things stand.
- Medical costs are – generally – under control.
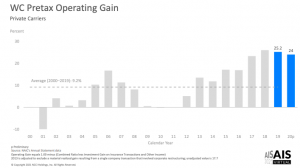
NCCI’s data (see slide 35) shows medical inflation remains in the single digits, where it has been for a decade plus. NASI research is even better news. Medical costs have declined – albeit marginally – from 2012 – 2017. - Payers’ approaches to managing medical haven’t evolved much – if at all – over the last decade plus.
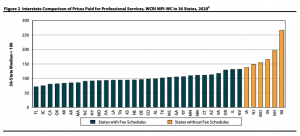
Large, broad PPOs paid on a percentage of discount below the Fee Schedule?U&C are the dominant “cost containment” technique. Yes, specialty networks have made big inroads, but overall the Coventry PPOs of the world are where the big “savings” below FS originate. - Those approaches are generally archaic, simplistic, too often based on the wrong metrics and don’t address quality.
Bill review in work comp is falling further and further behind provider revenue maximizers. Most vendors are complacent, driven by add-on fees for “savings” and “reductions” that are ephemeral at best, woefully lacking in innovation and blind to their own inadequacies.
There is so little focus on or attention paid to quality it might as well not exist. - The service entity landscape continues to consolidate, leading to fewer options for buyers and ultimately less control.
This will accelerate. - The vast majority of buyers treat service providers as nothing but interchangeable vendors, buying their services as if they were commodities; talking big about quality, customer service, partnership, and metrics and then buying on price. I’ll dig into each of these in future posts.
The good times will not last. Medical costs will increase – driven by facility expenses this year and thereafter.
I’ll dig into each of these issues, and what the future holds – in future posts.
What does this mean for you?
I can hear you thinking, “hey, we’re different and special, this isn’t about us.”

No, you’re not, and yes, it is.