Nov
30

Bill Review Survey, Takeaway #3

Our last Bill Review Survey was in 2012; things have changed a lot since then – and mostly for the better.

Overall Industry rating

Six years ago we asked the 24 respondents to rate their overall impression of vendors on our standard 1 – 5 scale: the result as reported in 2012:

In what might be best described as a wake-up call for vendors and application providers, there were no ratings higher than a 3.4, with the average a 3.07 on the 1-5 scale (among respondents who knew of the specific vendor).

Put another way, the people who use BR services view BR providers as generally mediocre/adequate/acceptable.

Today, the average rating was just under 3.3, a small but significant improvement.

However, there were significant shifts for individual companies.

In 2012 the three top vendors – Medata, Mitchell, and StrataCare were all in a statistical dead heat, with Xerox/ACS rated a full point lower. (Xerox/ACS bought Stratacare, converted most/all of its users to the Strataware platform, and now operates under the Conduent brand.)

No longer.

This year, we asked the 30 respondents to provide ratings of ten bill review vendors on four different metrics;

  • overall perception
  • handling the basics of bill review
  • customer service and implementation
  • innovation and forward thinking

(All respondents did not give ratings for all categories or companies; the findings below are averages across those respondents who gave a rating for that specific company).

Mitchell (3.75) and Medata (3.71) were in a statistical dead heat for top honors in Handling the basics.

For Customer service and implementation, Medata (3.94) was the clear leader with Mitchell second (3.54).

Medata held serve for Innovation (3.91) and Mitchell (3.5) again took second place honors.

Here’s where it gets interesting. Medata and Mitchell were essentially tied for Overall perception by respondents who rated them.

But across ALL respondents, Medata’s Overall perception rating was 3.4, with Mitchell at 3.08. While Medata has the lowest market share of the top three application providers, it was tied for highest name recognition among our 30 respondents, and thus garnered the top spot in Overall perception amongst ALL respondents.

Here’s where we link back to last week’s posts on the critical importance of customer service;  the data shows Customer Service has the highest statistical correlation with overall perception.

Note – Corvel shared the top spot in name recognition, but got the lowest rating for customer service – and was essentially tied for the lowest score for Overall perception.

What does this mean for you?

Customer service wins.

Note – I’ve received several anonymous comments/emails lately.  I’d remind commenters that anonymous comments on MCM posts are ignored, as are comments with fictitious email addresses.

You know who I am. I and my readers need to know who you are.


Nov
28

Bill Review Survey – Takeaway #2

One of the more intriguing findings from our third Survey of Bill Review in Work Comp and Auto pertains to data analytics.

Multiple questions probed into respondents’ utilization of data analytics. The questions ranged from the state of their data management program through the relationship between the future of BR and data analytics. In our 2012 Survey, numerous respondents stressed the importance of data analytics, data quality, data management, etc. But despite that emphasis six years ago, respondents seemed to have made little progress employing data analytics packages and integrating data analytics into BR and vice versa.

From the Survey Report (to be released in early December):

A surprisingly low number of organizations have invested significant resources into data analytics.  Only a handful of respondents report that their organization has acquired, sorted, and leveraged data sufficiently enough to begin building predictive modeling or provider profiles.

That’s not to say payers haven’t built data warehouses or aren’t developing analytics capabilities. In fact, “Every large and medium sized respondent said their organization aggregated and transferred bill review data to a data warehouse for analysis.” Rather, most are still in that data modeling development and construction phase; using that data to build models, profiles, and gain deeper understanding is still a ways off.

More narrowly, half of respondents who process their own bills internally tied a data analytics package to their BR product (a more limited approach than combining BR data with data from other sources such as pharmacy, claims, medical management, first notice, and external data sources) while only 6% of those who outsource bill processing used a data package with their BR.

This dichotomy isn’t surprising as external users are generally much smaller organizations.

To get even more specific, fewer than 20% of respondents mentioned building predictive models and in most cases respondents said data was compartmentalized and only used for particular departments such as finance.

We asked what was the greatest unmet opportunity in bill review; Only 10% of respondents specifically noted the importance of data analytics going forward. And, just 20% of respondents said that a higher level of data analytics would be the future of BR.

Considering the value added that accurate data analytics can provide on virtually all BR functions – not to mention the entire claims function, loss ratios, and financial results – and that a vast majority of respondents are not fully linking BR and data analytics, these results indicate significant opportunity.

Thanks to the 30 professionals who participated in the Survey, we have a clear picture of where the industry is today, and what they are looking for from vendors/partners tomorrow.

The respondents hail from all around the country, from insurers, state funds, TPAs, and large employers. Very large to very small, from national in scope to a single-state focus, these experts gave freely of their time and expertise and for that we are grateful indeed.

What does this mean for you?

The opportunity is clear.

Note – I’ve received several anonymous comments/emails lately.  I’d remind commenters that anonymous comments on MCM posts are ignored, as are comments with fictitious email addresses.

You know who I am. I and my readers need to know who you are.


Nov
27

Work comp services: Specialize or Generalize?

WorkCompWire’s Leaders’ Speak column features a two-parter from Jack Bailey of Bailey Southwell.  He has worked on a lot of transactions in our space and knows a lot about deal-making.

Bailey’s point about the growing importance of technology, and specifically the need for accreditation around cyber-security is dead on. His other thoughts on the importance of execution and customer service are as well.

I do have a different perspective on one of his statements.

From WorkCompWire:

Trend Away from Monoline Vendors to Integrated Service Offerings: While this isn’t necessarily a new concept in the industry, payers increasingly emphasize the benefits of having multiple service lines handled by a single vendor in their contract decisions. As an example, see the below quote from the recent quarterly earnings call of publicly-traded industry vendor:

…singularly focused vendors are quickly becoming obsolete while payers recognize a greater efficiency and effectiveness of integrated services.

Two points here.

First, outside of the quote – which I’ll get to in a minute – I don’t see any supporting evidence for this assertion. OneCall is the best example of a diversified service provider, and we all know how that experiment has worked out.

It hasn’t.

In contrast, single-focused vendors such as bill review firm Conduent, physical medicine management company MedRisk (HSA consulting client), DME/Home Health provider HomeCare Connect, and PBMs (most of which focus almost entirely on pharmacy) are doing well. Conduent and MedRisk are the largest providers in their business sectors, HomeCare Connect is growing rapidly, and PBMs myMatrixx (HSA consulting client) and Optum now dominate the work comp pharmacy business.

There are many reasons for this – which I’ve explored in past posts in mind-numbing detail – but the core issue is the same as in any other industry – doing one thing really, really well is hard enough. Doing several things really well is damn near impossible.

As Bailey noted, payers are demanding excellence in execution and customer service, demands that have (with rare exceptions) not been met by diversified service providers.

Point two.  The quote in Bailey’s piece comes from CorVel’s CEO. 

Of course Clemons would say that integrated services are the bee’s knees;  CorVel’s business model is predicated on getting as many dollars from its customers as possible.

Supporting evidence for my contention that single-focus companies are doing well, and are very attractive to investors is everywhere.

For example, SUNZ’ purchase of case management company Ascential Care and Mitchell’s acquisition of physician adviser/peer review/IME firm MCN. Both Ascential and MCN were founder-owned and had narrowly-focused businesses; they weren’t diversified.

Then there’s Paradigm’s acquisition of Adva-Net for about $110 million, a transaction completed in the last month or so. Adva-Net was also founder-owned (with some venture capital as well) and narrowly-focused; it brings a network of pain management providers and facilities to the table.

This follows Paradigm’s purchase of Foresight Medical last year. As I said last September, “Foresight’s niche is narrow but important – the company’s core business is negotiating prices for implantable surgical devices.”

Finally, in all my conversations with larger work comp payers, the vast majority of buyers want best-in-class services – because their customers expect and demand it. SVPs of Claims, VPs of Medical Management, Chief Medical Officers – I’ve never heard one say “I’ll take mediocre service levels and results because working with one vendor makes my life easier and is less burden on my department.”

Yes, there are exceptions, primarily for smaller payers who don’t have the staff or resources to handle multiple relationships. In that case, the “multi-offering supplier” approach makes sense, and this can be an attractive niche, with vendors building attractive businesses around wide service offerings.

What does this mean for you?

Market segmentation is key; understand what your buyers’ problem is, and solve it. Larger payers want best-in-class, and many smaller payers are looking for simplicity.


Nov
26

Bill Review Survey – Takeaway Number One

The three top takeaways from HSA’s 2018 Survey of Bill Review in Workers’ Compensation and Auto are:

  1. It’s all about customer service
  2. Analytics are lacking
  3. Medata leads the pack

We’ll dive into customer service today, and discuss the other takeaways later this week.

From the Survey’s Executive Summary:

The importance of customer service cannot be overstated. At a time when the BR industry and payer community are looking at e-billing advancements, connectivity, and predictive analytics to make BR faster and more efficient, customer service rose to the top of the list when discussing or scoring the most important aspects of BR.

Whether we were asking “are bill review vendors differentiated?”, “how important is customer service”, or how respondents ranked individual bill review vendors, customer service kept coming up. Whether respondents outsourced bill review or processed bills internally using a third-party application, whether their companies were large or small, operated in a single state or nation-wide, customer service and variations on that theme were pervasive.

For example, one may well think bill review is a commoditized business, where vendors compete on price and relationships. Fully 2/3rds of the 30 respondents believe bill review vendors are differentiated, primarily by responsiveness, customer service, and a sense of partnership.

Stepping back, this is not surprising.

In any commoditized market, the customer who believes they are being listened to, serviced promptly and competently, that their vendor/partner really cares about the relationship and is always looking to add value, will view that vendor as a partner – a key differentiator.

In non-commoditized businesses, buyers don’t care nearly as much about customer service. Think Apple; people stand in line for hours if not days to buy their latest tech because it can do all this innovative stuff, has a really great camera and screen, can store a gabillion photos…(and many of us love to show off our latest toys to jealous friends). And often that tech has bugs and costs a fortune and shatters when you drop it and battery life sucks and it is obsolete in months… (Disclosure – I’m an iPhone, Mac Air, and Mac desktop user…but I’ve never camped out at a Store)

Or Tesla.  Costs a mint, one has to wait months to get the car you want, software can be buggy, getting service is a pain in the neck, charging is NOT easy or simple or readily available in many places…Yet lots of people buy Teslas.

I know, there are deep psychological/emotional reasons we humans want to own iPhones and Teslas. That doesn’t negate the key point here – people buying highly differentiated products don’t care about customer service.

Service can be THE differentiator in a commoditized business.  

Tomorrow, data analytics.

What does this mean for you?

Much of workers’ comp – claims, medical management, insurance, related services – is pretty much commoditized. I would argue  – and the research clearly indicates – that differentiation is not only possible, but critical to your company’s survival and success.


Nov
13

Tuesday catch-up

It’s been a very very busy time.

First, I’m pretty darn excited to note my alma mater’s football team goes into it’s match with Notre Dame ranked 12th in the nation. As a long-suffering Syracuse alum, this is territory we haven’t seen in decades.

Perhaps we’ll see Chris LeStage’s LSU Tigers in a Bowl Game???

OK, on to work.

The National Work Comp and Disability Conference is fast approaching. You can get a discounted registration here.

A bit further out on the schedule is WCRI’s annual confab – which will be in Phoenix AZ next February 28 – March 1.  You can get the details here. DO NOT WAIT to register; this always fills up so don’t procrastinate.

Next, a best-in-class work comp safety program is the product of a “great team” led by a very experienced and very competent leader. Joe Molloy at Northwell Health is innovative, focused on the right things, and committed to partnering with service suppliers. Joe’s team has reduced lost work days at a giant healthcare system by a third.

More proof of the ongoing effort by health insurers to move the US to single payer…this insidious plan is bearing fruit as we just received new evidence of its effectiveness – Americans don’t like their health insurance.

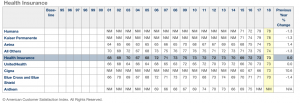
According to a national survey by ACSI, consumers rank their satisfaction with health insurance as equal to airlines. “Health insurance satisfaction is flat after two years of gains, staying lowest in the Finance/Insurance sector” Ouch.

I find it increasingly likely we’ll have some form of single payer, perhaps Medicaid for all – within a decade.  Health insurers continue to piss off customers on a regular basis, can’t control health care cost increases, and are lousy at branding.

They do have gazillions of dollars which they will spend to kill MFA or any other version of single payer – and they are pretty darn good at the government lobbying thing.

That said, when things can no longer continue, they won’t.

What does this mean for you?

It’s not a question of “if” we end up with single payer, it’s a question of when.


Nov
9

Work comp claim counts – part 4

Two important data points hit the news this week, both worthy of your attention.

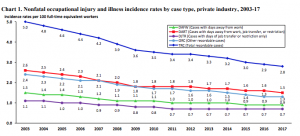
First, BLS data indicates private industry employers reported 47,000 fewer occupational injuries and illnesses in 2017 compared to the previous year, a decrease of about 1.7 percent.

The rate, or frequency of total reportable cases declined by 0.1 cases per 100 FTE. As we’ve reported in the past, BLS data does not precisely mirror work comp claims – but it’s very close.

(Note this does NOT include public sector employer data)

So, occupational injuries and illnesses, along with work comp claims frequency, both dropped last year.

Next, insurer CNA CEO Dino Robusto said this in CNA’s earnings call:

we’ve been seeing negative sort of mid single-digit frequency trends over the past several quarters, which is less negative than a year ago. Now, while we’ve seen some pockets, where frequency has increased, the negative frequency trend overall is still favorable to our long run trend assumptions, because we did not lower our long run frequency assumptions despite the actual frequency consistently more negative than our assumption. [emphasis added]

(thanks to SeekingAlpha for the transcript)

Recall the Hartford has seen an uptick in claims frequency of late, one their CEO opined is not unique to his company.

I checked on other major workers’ comp insurers, including the Travelers, and  AIG and did not find anything useful pertaining to frequency or claim counts.

So, what does this mean for you?

Watch your claim frequency carefully, especially in geographic areas and business sectors where hiring is very tough. It could be you’ll see an uptick in claims, due probably to compromises in hiring due to the tight labor market.


Oct
31

Workers’ comp claims, OSHA reportables, and why both are dropping

Well, some posts get a life of their own, and so it is with this discussion of claims frequency and claims counts. After much discussion with colleagues and several back-and-forth emails with WCRI CEO John Ruser PhD about the correlation of OSHA recordable data and work comp claims and why both are declining, I decided the best way to get this to you, dear reader, is via an interview. So, read on.

MCM – I believe that you were responsible for the BLS OSHA-recordable injury data for years. What are a couple key points readers should know about the OSHA-recordable reports?

Dr Ruser – Yes, I was BLS Assistant Commissioner for Occupational Safety and Health Statistics for over 5 years and was a researcher of the BLS OSHA data for many years before that.

While there has been some controversy about the completeness of reporting in the OSHA recordkeeping system (see below), the BLS OSHA-recordable injury rate data are extremely valuable for several reasons.  They are very detailed by State, by industry, by establishment size and by worker characteristics, so that are an important benchmarking tool for risk managers and others seeking to compare their company’s injury rates against their peers.  From the perspective of focusing injury risk reduction efforts, they are important in identifying those groups of workers at higher risk of injury and they are used by OSHA to identify high-risk industries for inspections.  And, with their long relatively-consistent time series and detail, they are a valuable tool for researchers seeking to understand factors that contribute to workplace injuries.

MCM – Where does BLS get the data for the OSHA-recordable reports?

Dr Ruser – BLS’s estimates of OSHA-recordable injuries are based on a very large annual survey of about a quarter-million establishments (that is, specific locations of a company or organization) called the Survey of Occupational Injuries and Illnesses (SOII).  The SOII contains employer-reported data drawn from the OSHA logs that establishments keep throughout the year.  SOII covers non-fatal occupational injuries and those illnesses that can be directly linked to a workplace.  A separate BLS program, the Census of Fatal Occupational Injuries, uses multiple data sources, such as death certificates, OSHA reports and many other sources, to track workplace deaths due to injury.

MCM – there’s been questions about the decline in reportables over the years. Can you comment on these questions?

Dr Ruser – Some skeptics of the declines in the BLS OSHA-recordable injury rates attribute these declines to changes in OSHA-recordkeeping rules and practices or tightening in WC compensability rules, meaning the declines in injury rates are at least in part an artifact of reporting.  External research supported by BLS and other non-BLS-supported research does suggest that the number of injuries captured in SOII undercounts the true number of OSHA-recordable injuries.  (BLS has a very complete webpage on SOII data quality research that you can access here: https://www.bls.gov/iif/soii-bibliography.htm)

But, while the numbers (levels) of injuries and claims may be undercounted, the issue for the observed declines (trends) in injuries (and WC claims) is whether underreporting has grown.  There is little direct research on this.  A study by Washington State comparing SOII data to WC claims found that during the first five years of the study period (2002 – 2006), underreporting decreased, while it increased from 2007 to 2011.  Importantly, the Washington State researchers concluded that the total estimated actual number of SOII-eligible WC time loss injuries decreased over the ten year span, meaning there were real declines in injuries (and some underreporting too).

The Washington State study was excellent, but it focused on one state and a relatively short time span, which included a great recession during the second half of the study period when underreporting was identified.   Another approach to validating the time trends is to compare to other data that should not be susceptible to the concerns raised about reporting.

MCM – what analyses did you do to explore that issue?

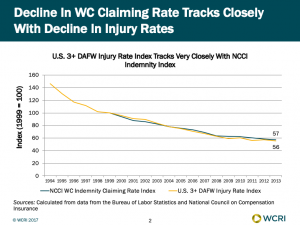
Dr Ruser – I compared the SOII data with data from other sources.  First, I looked at how the US injury rate for 3 or more days away from work tracks with the NCCI indemnity claiming rate.  The declines in these two data series track extremely closely.  So, while the OSHA recordkeeping system is technically independent of workers’ compensation, the BLS injury data and the NCCI claims data are telling the same story and the BLS data can be used to try to identify factors associated with the decline in the NCCI WC claiming rate.
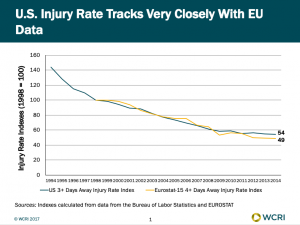
Regarding whether the BLS injury rate decline is real, I created an index of the OSHA-recordable case rate for cases with 3 or more days away from work and lined it up with a similar index for 15 EU countries for injuries with 4 or more days away from work (the series most comparable to the US data).  The chart that is attached shows how similar the trends are in the US and in the EU.  The index was set to 100 for injury rate values in 1998 and the other values in the chart are injury rates relative to 1998.  As of 2014, the US injury rate was 54 percent of its value in 1998, while the EU injury rate in 2014 was 49 percent of its value in 1998.
MCM – what does this mean (for our readers)?:

Dr Ruser- The remarkably similar trends in the US and EU data suggest that we need to look beyond US-specific explanations (such as OSHA-recordkeeping rules or WC compensability rules) to understand what is responsible for the long-run aggregate declines in injury rates and WC claims rates.  While there may be some changes in reporting at least over part of the past quarter century, the good news, I believe, is that there has been a remarkable improvement in safety and this improvement is seen in most industries and in many developed countries.


Oct
30

Workers’ comp claim frequency – part 2

Two messages from colleagues about yesterday’s claim frequency post add important nuance and depth to the issue.

First, thanks to WCRI CEO John Ruser PhD for his note with more current information on recordable data.

These data are critical as they are the only source I know of that records the actual injury numbers, or counts of occupational injuries and illnesses. Almost all other sources document percentages based on premium dollars or FTEs. While those are useful, service providers really want to know the actual number.

Ruser [emphasis added]

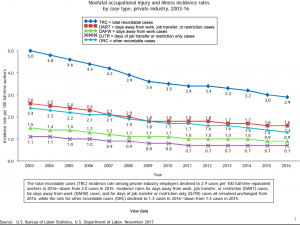
BLS has data through 2016 on its website (the chart book is easiest to digest and can be found here: https://www.bls.gov/iif/osch0060.pdf)  The data show continued decline in OSHA-recordable rates through 2016, particularly among “other recordable cases.”  BLS will release updated non-fatal injury data through 2017 on November 8.

I agree with you that credible research on why rates are declining is lacking.  There simply aren’t good data to tease out the possible factors.  Interestingly, shifts in hours worked away from high hazard industries does not explain the long decline in rates.  The vast majority of industries are experiencing declines.  I documented this in a paper I wrote for the American Journal of Industrial Medicine. 

I’d emphasize John’s comment on high hazard industries. I’ve opined that fewer injuries in heavy manufacturing and construction were a likely contributor to the reductions in trend; thanks to John for correcting my error.

Next, from a former state workers’ comp director. [emphasis added]

as I look at chart provided in your blog today it took me back to the early days after the reform of XXXX. As can clearly be seen in the chart starting in 1992 the trend started down and has continued ever since.  A lot of risk managers and safety staff took a lot of credit for those numbers as proof that they were doing a good job. I remember at the time thinking boy this looks really good but surely there is another explanation other than the [legislated] reform and all that we were doing in safety and I was right. Even after the… emphasis on safety [was reduced]…the number continued to go down. As I look back I was just in the right place at the right time.  But when good things happen that can not be explained we tend to take credit for them

This expert’s view is well worth repeating, perhaps best said by Tacitus:

victory is claimed by all, failure to one alone

What does this mean for you?

Claim counts are dropping – and will continue to do so. There is little “white space”, so growth for claims service companies will come from taking business from competitors.


Oct
29

Workers’ comp claim counts are down…right?

A recently-released analysis of workers’ comp claim frequency tells us what we’ve known for years – the percentage of workers that gets hurt on the job has been and continues to drop.

Yet one major insurer indicates there are warning signs that frequency may be ticking back up, albeit in a tightly defined sector of the economy. More on that below.

There are many theories about why frequency has declined for decades – more automation, more emphasis on safety programs and loss control, less heavy industry here in the US, low investment in infrastructure leading to fewer jobs doing heavy construction. Many theories, but I have yet to see any credible research into exactly why frequency is declining.

This is one of those data points that is enormously important, yet it doesn’t get enough attention. So, here’s the skinny.

Claim frequency is a percentage  – the number of injuries compared to premium dollars or FTE workers. Therefore the number of work comp claims is driven by the denominator; if premium or employment goes up, that can offset a decline in the percentage of claims.

But employment is about maxed out, so any changes in the percentage of claims will closely mirror the actual number of claims.

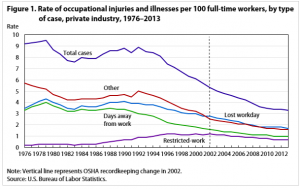
Another way to track the number of claims is to compare it to Federal data on the actual number of occupational injuries and illnesses. The graph below shows that the actual number of claims per 100 workers…

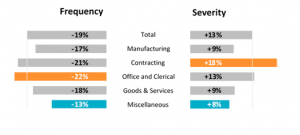
You’ve already figured out that the graph ends in 2013…so what about the intervening years?  Fortunately NCCI provides ongoing research into just that here.  When you dig deeper, we learn that total frequency dropped almost one-fifth from 2011 to 2016, led by office and clerical job classes.

As we learned at AIS in May, NCCI estimated frequency declined another 6 percent in 2017; the average decline over the last two decades has been 3.7 percent.

But.

Last week the Hartford announced it is seeing early indications of an uptick in claims volume. Chairman and CEO Chris Swift said [emphasis added]:

“workers’ compensation 2018 frequency trends are elevated from expectation…

our frequency in small commercial and middle market has turned positive this year. Based on our business and economic analysis, we view this trend as broader than just our book of business.

Many businesses are struggling to find qualified employees and beginning to add more new workers to their payroll, generally increasing the risk of workplace injury versus what it would have been say a year or two ago.

Additionally, the tightening labor market produces more hours work for employee often resulting in fatigue and less training time compounding the risk of injury for the less experience workers.

Our uptick in frequency change has been moderate turning positive on a rolling 12-month basis. The actual frequency levels are now comparable to what we experienced in 2016 which is a very manageable shift in a book of business as large as ours.

The frequency increase is more pronounced among less tenured employees and it can be several times that of experienced workers.”

Notably, the Hartford attributed a 3.5% increase in Accident year combined ratio for its middle market business to this increase in frequency.

Couple of key points about this.

  1.  The Hartford is the largest national seller of work com policies to small employers, and thus has the broadest lens.
  2. As a major writer, it also has lots of dollars to invest in business analytics – so it knows more faster than many insurers do. This from Hartford President Dough Elliott:

we have now installed a new claim platform over our 5,000 desk throughout claim. And the ability to access what I’ll call structured data and to slice and dice and be on top of it and to look at your metrics and watch your trends is much advanced from where we were five years ago. And so we have monthly and weekly discussions but we’re sitting on top of trends that candidly five years ago were very manual in nature to try to get our arms around and they were slower than we’d like to them to be.

What does this mean for you?

  • This is not unexpected; we are close to max employment; small employers are desperate for workers and don’t have the time/expertise/resources to screen/train/protect those workers.
  • Time to look at your data – closely.
  • And likely time to dust off those underwriting, safety, and loss prevention manuals.


Oct
26

Tulips, winter, and value – the world of work comp services investments

Over the last decade I’ve worked with over 30 investment firms on perhaps 60 deals.  One question I almost always get is:

Would you buy this company?

And a related question:

What would you pay for this company?

For years I tried to answer those questions, factoring in the company’s service reputation; the uniqueness of it’s services and/or business model; experience of management; value delivered to it’s customers; and a bunch of other stuff.

I finally realized those criteria often had little to do with the “value” defined by most investment firms. And much more to do with Dutch Tulips.

To most private equity firms, “value” is what can they sell the company for in a few years. One would think the selling price would be driven in large part by those other criteria; in many cases, one would be wrong.

Recent valuations of some work comp service companies are – in my view – completely disconnected from the actual value inherent in these companies – actual value defined as the value they bring to their customers and the potential for those companies to grow and prosper.

In fact, what seems more important than actual value is the ability of the seller to craft a story about how the company is going to grow, it’s unique business model, it’s scalability and potential to be a platform to which other acquisitions can be added. This is typically future-forecasting, theoretical stuff based on assumptions thin enough to blow away in the slightest of headwinds.

But more often than not, enough potential investors buy into the story to create a bit of a feeding frenzy, until one agrees to pay way more than that company’s actual value.

I’m far from an investment expert – one look at my personal portfolio will prove that – and in no way am I saying the brilliant folks at private equity firms don’t know what they are doing.  Far from it – these people are doing exactly what they are supposed to do – make gobs of money for their investors.

What I am saying is these firms are rewarded when they sell the companies they bought for a lot more than they paid. That works out really well – if they can find someone to buy it at a hefty markup. At some point the next owner – or the one after that – finds out that the actual value of that company is far less than they thought.

It’s also known as the Greater Fool Theory, or the Dutch Tulip problem. You know the asset isn’t worth what you’re paying, but you’re sure you can find someone else who will pay more than you did.

What does this mean for you?

Beware of tulips. They flourish until winter comes. And winter ALWAYS comes.