Jun
22

Work comp -The Innovation Prevention Industry

Workers’ comp is the Innovation Prevention Industry.

As I wrote years ago, many executives, risk managers, “thought leaders” and brokers decry the lack of innovation in workers’ comp – yet they are often the very reason innovation doesn’t happen.

There are a host of reasons – cultural, practical, financial, historical, structural – all hampering, if not outright preventing real innovation.

Fundamentally, work comp is hyper-conservative, hidebound and traditional. A few notes…

  • it’s almost entirely about musculoskeletal injuries – which haven’t changed for about a million years (no, that’s not hyperbole). Cause, treatment, and physical recovery are extremely well-understood – at least for those who want to understand.
  • it’s insurance – which by definition is risk-averse
  • it’s not important to the C-suite – work comp costs are a rounding error on corporate ledgers, account for <1% of US medical spend, and are steadily decreasing.

Structural problems  – starting with the RFP process – kill off innovation, starving it of light and energy before it can take root.

In most – but not all – cases, the RFP/vendor selection process is just stupid. The entire thing is intended to allow the committee to pick a vendor – to compare apples to apples by forcing respondents to tell how they will deliver a specific, detailed, highly-structured solution that precisely meets specs.

That’s fine – but what if you really need an orange?

Instead, the buyer should ask how each vendor will solve their problem, what they do differently, how they can deliver better results, and what the buyer must do to achieve break-through results.

Next – other barriers to innovation, and why you need to blow them up.


Jun
17

Thursday catch-up

Doing my best to avoid work on Fridays…so moving this occasional catch-up post to Thursdays…

COVID

Promising news on the effectiveness of a drug to help infected patients fight off the virus was reported by the Economist. The good news – Regen-Cov:

saved the lives of many of those unable to make their own antibodies in response to SARS-CoV-2. Such “seronegative” individuals constituted about a third of the 9,785 hospital patients in the study…compared to a control group given standard treatment … 20% more patients survived

The bad news – it’s stupid expensive, and supply chain issues are hampering production.

A study conducted by the National Institutes of Health indicates COVID may have been in circulation earlier than originally thought. Blood samples from Illinois, MassachusettsMississippi, Pennsylvania and Wisconsin indicate the virus was in those states in December 2019. An earlier CDC study found similar evidence in California, Oregon, and Washington.

These findings indicate a better and more thorough process to identify disease outbreaks may well be warranted.
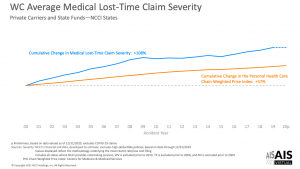
Comp drugs

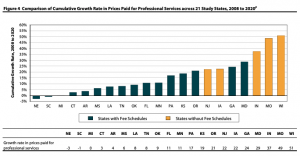
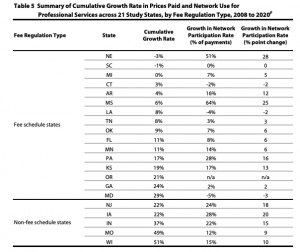
WCRI is hosting a timely webinar on Interstate Variations and Trends in WC Drug Payments on June 24. Register here. Gotta say I’m darn impressed by the researchers’ ability to obtain, analyze, and report on payments as recent as Q2 2020. This makes WCRI’s information much more actionable for regulators, clinicians, and payers alike.

Dr. Vennela Thumula and Dongchun Wang of WCRI will be guiding us thru their findings; the webinar is free.

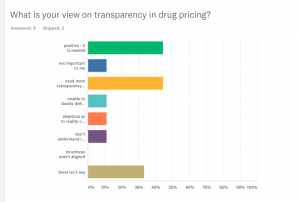
I am finishing up the latest Annual Survey of PBM in WC which will have 2020 and 2019 data; last chance to participate and receive a detailed, respondent-only version of the report. If you want to participate let us know in the comment section below (there’s no cost to participants).

Couple interesting – and very preliminary – takeaways…

  • growing interest in transparency, along with an increased awareness that this isn’t a simple issue.
  • spend continues to decrease, with respondents attributing some of the decrease to COVID.
  • opioid spend continues to drop, but most respondents are still struggling to help chronic pain patients/long-time users of opioids reduce usage.
  • there’s a growing awareness that the PBM pricing model needs to change. With spend declining and a push for transparency, knowledgeable payers understand that paying PBMs less year after year is not sustainable.

Previous public versions of the Survey Report are available here for download at no cost.


Hospital pricing

Hospitals are supposed to be publishing their prices – at least Federal regulations require them to. But those smart, sneaky administrators are figuring out all kinds of ways to avoid telling you how much it will cost for that MRI, drug, band-aid, or lung transplant.

From JAMA:

hospitals must publish discounted cash prices (applicable to uninsured patients) and payer-specific negotiated rates. Second, hospitals must display price data, including expected out-of-pocket costs, for “shoppable services” that can be scheduled in advance (eg, office visits) in a consumer-friendly manner that facilitates service-specific comparisons across hospitals (eg, price estimator tools). [emphasis added]

As of early March, only 17 of 100 randomly selected hospitals were complying with the regulations. The penalty for non-compliance is…wait for it…

$300 a day.

Perhaps if the Feds charged hospitals the same way hospitals they charge us, we’d have a bit more compliance. 

How about…the Feds tell the hospitals after the fact what the cost will be, based on a “compliance chargemaster” that takes into account the hospital’s margin, quality scores, number of collection suits it has filed, and medical error rate.

Thanks to the estimable David Deitz MD PhD for the head’s up.

Wellness works

Finally, HealthAffairs reports wellness programs don’t really improve population health, reduce healthcare spending, or improve employment outcomes. 

Almost 40 years ago, I was halfway through a Master’s of Science in Health/Fitness Management when it became obvious this was NOT going to be a lucrative career…quite the opposite. Not saying I was prescient, just that employers sensed this was a nice-to-have and not a got-to-have, and that lack of importance showed in salaries.

Dodged that bullet.

And really finally, congratulations to my favorite baseball team – the White Sox have the best record in baseball after taking 2 of 3 from Tampa Bay. I

know my friends in the Bay area will be heckling me when the Rays surge again…hey, you gotta take advantage of good news when it comes!


Jun
15

A business model in search of a problem

The workers’ comp services business is brutally competitive; a shrinking pie fought over by increasingly aggressive vendors, each striving to differentiate and demonstrate value.

Smaller players and newer entrants are pushing hard, attempting to show how their approach/service model/pricing/technology is better than more-established competitors’. This is keeping the big players on their toes, forcing them to improve, revise, deliver, respond…even innovate.

I can’t – and wouldn’t – fault any vendor for its efforts to differentiate. For buyers, the key is to discern which “differentiators” are actually useful, and which are just marketing-speak intended to make the vendor’s business model viable.

Blah blah blah blah blah…blah

A couple ideas may help separate the real from the flashy.

First – what problem does this solve? and is that your’s, or the vendor’s?

I’d suggest buyers can cut to the core if they ask:

  1. is this is going to decrease my combined ratio?
  2. by how much over what time period?
  3. at what internal cost? and
  4. how – exactly – is it better, and by how much, than my present approach.

Second, what proof statements is the vendor using to get your attention?

Are they comparing their “results” to industry leaders? If so,

  1. Where – exactly – are they getting the data re the leaders’ results?
  2. What is the basis for comparison – are the types of claims, patient demographics, injury types and severity, diagnoses, co-morbidities, employer types, and jurisdictions the same for the new vendor and the industry leaders?
  3. Does the new entrant have enough claims (that are similar to its competitors) for the comparison to be statistically valid?

Finally, dig deep into the methodology and thinking behind the vendor’s approach. Do they really understand at a deep level the problem they are solving, and can they clearly articulate:

  • the causes and origination of the problem (e.g. facility costs are increasing due to revenue maximization efforts by healthcare systems driven by financial pressures)
  • why the current solutions do not meet the buyer’s needs (e.g. broad-based WC PPOs have little negotiating leverage, don’t assess quality, and benefit from high prices and lots of services), and
  • how their solution is better, sustainable, and where and how it integrates into the buyers’ operations, processes, and technology and is consistent with regulatory requirements.

What does this mean for you?

This is not to say there aren’t better answers out there – indeed there are.

The key is to quickly identify solutions with real potential to solve your problem, as opposed to those that solve the vendor’s.


Jun
14

The future of telehealth

Is going to be a lot clearer when Congress finishes work on the Connect for Health Act.

The bill has Bipartisan backing from 57 Senators, and would:

  • permanently remove geographic restrictions on telehealth,
  • allow patients to do visits from their homes and
  • grant the Secretary of HHS permanent authority to waive telehealth restrictions.

It is possible a competing bill  – which would only temporarily extend telehealth waivers – will be passed instead of the Connect for Health Act. Regardless, it’s clear telehealth is going to be a major part of US healthcare going forward.

Emergency regulations that lifted restrictions on telehealth are likely to extend thru the end of this year; these were a response to COVID.

One key issue is whether phone calls will “count” as telehealth, a change that would certainly expand the availability of these services, as even today many patients don’t have access to reliable internet and/or a video-connected device.

One likely change is reimbursement; expect Congress/HHS to reduce reimbursement for telehealth visits.

Impact…

I’d expect most workers’ comp fee schedules to follow Medicare’s lead – even those that aren’t directly tied to Medicare.

What does this mean for you?

When Medicare does something, everyone else soon follows. 


Jun
7

Has anything changed?

The internet, smart phones, electric vehicles, 9/11, genome sequencing…a lot has changed since 1990.

But in workers’ comp…not so much.

About 30 years ago OUCH (now part of Coventry) started the national workers’ comp PPO business. Liberty Mutual execs (literally) handed OUCH a bunch of three-ring binders stuffed with contact info for the providers Liberty used, and asked OUCH to build one of those new network thingies.

OUCH did just that, then went out and marketed its network to every WC payer, merged with HealthCare Compare, became FirstHealth then Coventry Workers Comp, merged with Concentra’s PPO along the way, and got sold a couple more times.

Outside of several name changes, nothing has really changed since that fateful delivery of intellectual property. 

Sure, there’s been a lot of talk about “outcomes based networks”, but uptake has been minimal.  Reimbursement is still based on fee-for-service (the more service, the more fees), quality assessment is poor to non-existent, and buyers measure PPOs based on how deep the discounts are and how thick the provider directory is. Specialty networks have carved a big chunk out of PPOs, but many payers still access specialty services via their PPO contracts.

Networks charge payers a percentage of the discount below fee schedule/U&C – so the higher the charges, and the more charges there are, the more money the network makes. And the higher employers’ medical costs are. (I CANNOT BELIEVE I AM STILL WRITING ABOUT THIS AFTER 17 YEARS)

There were some promising attempts to do things differently…Sixteen years ago Crawford and Liberty Mutual got into the predictive analytics business.

“…Liberty Mutual uncovered what it believes are the two keys to managing workers’ comp medical costs.
First, the statistical averages for treating specific injuries in any city or state – for example, how many office visits are needed to heal a torn rotator cuff in Denver, or what does it cost to set a compound arm fracture in Pennsylvania. Second, how individual caregivers and facilities in the area compare to that baseline.”

Coventry started their Outcomes-Based Networks, some California payers (the State Fund being the leading example) set up their own tight MPNs, and the WC Trust of CT built a terrific network for its customers. While laudable, these are exceptions.

I get WC predictive analytics is really knotty for a host of reasons, but here we are, in 2021, with most payers having made little if any progress managing cost – and with the exception of pharmacy and some specialty niches – no progress on quality.

This is why lost time claim medical costs per claim have doubled since 2000.

chart courtesy NCCI

It is also why workers’ comp medical costs are set to increase this year and the ones to come.

What does this mean for you?

Until employers demand better, it won’t be.


Jun
3

What’s the state of work comp “managed care”?

I spend a lot of time in the weeds, digging into

That’s all well and good, but I tend to lose track of the big picture – in this case – what’s really going on in medical management these days, why, does that make sense, and what does the future hold?

So here’s where things stand.

  1. Medical costs are – generally – under control.
    NCCI’s data (see slide 35) shows medical inflation remains in the single digits, where it has been for a decade plus. NASI research is even better news.  Medical costs have declined – albeit marginally – from 2012 – 2017.
  2. Payers’ approaches to managing medical haven’t evolved much – if at all – over the last decade plus.
    Large, broad PPOs paid on a percentage of discount below the Fee Schedule?U&C are the dominant “cost containment” technique. Yes, specialty networks have made big inroads, but overall the Coventry PPOs of the world are where the big “savings” below FS originate.
  3. Those approaches are generally archaic, simplistic, too often based on the wrong metrics and don’t address quality.
    Bill review in work comp is falling further and further behind provider revenue maximizers.  Most vendors are complacent, driven by add-on fees for “savings” and “reductions” that are ephemeral at best, woefully lacking in innovation and blind to their own inadequacies.
    There is so little focus on or attention paid to quality it might as well not exist.
  4. The service entity landscape continues to consolidate, leading to fewer options for buyers and ultimately less control.
    This will accelerate.
  5. The vast majority of buyers treat service providers as nothing but interchangeable vendors, buying their services as if they were commodities; talking big about quality, customer service, partnership, and metrics and then buying on price. I’ll dig into each of these in future posts.

The good times will not last. Medical costs will increase – driven by facility expenses this year and thereafter.

I’ll dig into each of these issues, and what the future holds – in future posts.

What does this mean for you?

I can hear you thinking, “hey, we’re different and special, this isn’t about us.”

No, you’re not, and yes, it is.


May
27

The latest on work comp pharmacy

I’m almost halfway thru the 17th (!!) annual survey of Pharmacy Benefit Management in Workers’ Comp.  Here are some VERY preliminary results (which are almost certain to change).

If you are a WC payer and want to participate, drop me a note in the Comments section.  Public versions of past surveys are here, respondents receive a much more detailed version.

Findings

All but one respondent saw a drop in drug spend from 2019 to 2020; the biggest cost reduction driver was fewer claims.

Despite a 7+ year trend of declining drug costs, respondents view prescription drug issues as somewhat more important than other medical issues. This is likely driven by drugs’ impact on recovery and return to work.

Transparency remains a significant concern, with only 2 respondents having full visibility into drug costs. Most want more transparency and no one is really comfortable with AWP.

Opioid spend continues to decline...which is the good news.  Not-so-good is the continued problem of helping long-term users reduce or eliminate opioids. Prescriber intransigence is the major obstacle followed by attorneys blocking access to patients.

Few payers have audited their PBM and those that have are (mostly) just checking AWP pricing compliance.

Several noted out-of-state mail order pharmacies – mostly IWP and entities in Pennsylvania – continue to be a sore spot, adding cost, negatively affecting clinical management, and wasting adjuster time.

What does this mean for you?

Costs are down, but pharmacy is about much more than the price of the pill. 


May
26

Have work comp payers given up on physician dispensing?

It sure looks like they/you have.

WCRI’s latest report finds:

  • Physician-dispensed drugs (PDDs) accounted for more than half of drug costs per claim in Q1 2020 in four states – Florida, Georgia, Illinois, and Maryland.
  • In 12 states, doc-dispensed dermatological agents accounted for most payments for this drug class.
  • Louisiana is worst-off, with employers paying $190 per claim for dermo drugs in the 1st quarter of 2020…Illinois is right behind at $181.
  • Kansas and Connecticut saw payments for those dermo drugs triple from Q1 2017 to Q1 2020.

That profit-sucking prescribing by docs in Connecticut is why total drug spend increased 30% in the Nutmeg State – making it one of two states that had drug spend increases. Florida – the home state of PDD – was the other. (Across all subject states, drug costs dropped 41%.)

Having lived in CT for over 20 years, I’m really stumped by the precipitous increase in skin care drugs.

What could POSSIBLY be driving this massive need for occupationally-driven skin care/topicals?

Did sun spots create a pandemic of skin cancer but somehow only affect the second-smallest state?

Did a massive refinery accident expose tens of thousands of workers to burns or skin infections?

Did a hyper-virulent new breed of poison ivy run rampant, affecting thousands of landscaping and municipal workers?

Did the emerging cannabis industry fail to protect its workers from fertilizer burns, exposing thousands of workers to painful blisters?

Did everyone in Connecticut suddenly become unable to swallow a pill?

Of course not.

The real question is this:

why haven’t insurers, TPAs, and self-insured employers used CT’s Medical Care Plan to ban physician dispensing? Payers including the Workers’ Comp Trust of CT have pretty much eliminated physician dispensing.

It’s not just Connecticut.  PDD costs are outrageous, and all credible research indicates PDD is totally unnecessary, increases medical costs, and prolongs disability.

WCRI’s research should be a call to action.  Legislators, regulators, and payers are doing their policyholders and clients a disservice by failing to aggressively attack physician dispensing.

And those clients and policyholders are equally at fault – it is up to you to work with your PBM and payer to stop this rampant profiteering. 

What does this mean for you?

Yeah, I know it’s hard. Most important things are. Get to it.


May
21

One is not like the others.

Hospital in patient and outpatient, surgery, DME/home health, PT, pharmacy, imaging, lab…

Which one is NOT like the others??

That’s easy – when it comes to impact on legacy/older claims, it’s all about pharmacy. The older a claim is, the greater the percentage of spend is for drugs.

The older and more costly the claim, the greater the percentage of spend is for drugs (except for those cat claims needing long-term home health/facility care).

And, the higher the reserves, the greater the percentage of those reserves is for drugs (except for those cat claims needing long-term home health/facility care).

Both graphs from NCCI; Medical Services by Size of Claim—2011 Update.

Updated information from NCCI...shows drugs continue to be a major driver of claim costs in older claims…excellent research by NCCI’s Matt Schutz…

especially for those really expensive claims.

But that’s only half the story.  The other half is the impact the type of drugs has on claim outcomes. Most simply, most patients on opioids after 8 years need a lot of help, assistance, patience, and support to recover functionality. Some can do well on opioids – most do not.

What does this mean for you?

So, how are you buying PBM services? 

Do you even ask how the PBM will help reduce long-term drug spend?

Do you ask to see data on their results by age of claim?

Do you dive deep into their abilities, tools, programs and approaches to addressing long-term claims?

Does their reporting support this by identifying, tracking, and quantifying results?

If you aren’t focusing on the PBM’s impact on long-term claims, you’re doing it wrong.


May
19

It’s the price – and the network penetration – that drives cost.

That’s the conclusion I reached after reviewing WCRI’s latest treasure trove of research on medical prices paid for professional services in workers’ comp. [report is free to download] Sure utilization is a very important driver, but the biggest difference in medical costs across states is price.

Rebecca Yang PhD and Olesya Fomenko PhD  have outdone themselves with this edition, cementing their reputation as two of the most knowledgeable experts in the nation on medical costs in workers’ comp.

Kudos to WCRI for including data from the first half of 2020 in their report…the fine folk in Boston have done a great job speeding up data collection and analysis to the point where we have data that is less than a year old. This is helpful indeed for anyone trying to understand what’s happening and why and what to do about it.

Takeaways

  • Wisconsin’s professional services (MD, PT, etc) are darned expensive. WI has a very provider-friendly
  • While prices paid in non-FS [fee schedule] states generally increased more than in FS states, NJ is an exception. WCRI noted that NJ saw a pretty significant increase in network penetration during the study period; I’d suggest NJ’s employer direction laws directly contributed to lower price increases.
  • Network participation varies widely, and generally the more the growth in network penetration, the lower the increase in prices paid.  However, in some cases (PA), it doesn’t.
  • Finally, there’s a VERY useful chart on p 39 providing network penetration rates for each of the 36 states studied. 

What does this mean for you?

This is extremely useful information, with many nuggets buried in the 190 page report.  IF you aren’t a WCRI member – join now!