May
23

Hartwig on the economy and workers’ comp

Dr Bob Hartwig of the University of South Carolina gave his annual whirlwind tour of all things economic. The net – his talk was an exuberant paean to the US economy – and the impact of that economy on workers comp.

My view –

  • the data doesn’t indicate the economy has noticeably strengthened over the last year or so;
  • consumer and small business confidence levels are notoriously fickle; and
  • there are lots of warning signs out there that merit close attention; warning signs that weren’t adequately addressed in the talk.

While he briefly noted several potential issues with the economy, overall Bob painted a picture of businesses investing, consumers spending, profits abounding, and sunshine and happiness all around.

I’m not so sure.

For example, he cited as one reason for the nation’s positivity this datapoint; GDP growth was north of 3 percent for two quarters last year. Well, that’s true. However…

He chose two quarters where growth was over 3 percent – but in reality annual growth was 2.6% last year.

And 2.3 percent for the first quarter of 2018.

And last year’s 2 quarters paled in comparison to the 3.5 percent growth in 4 out of 5 quarters we saw in 2013-2014.
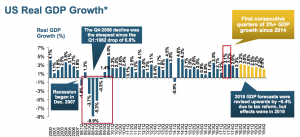
A 2.6 percent annual increase is solid, but by no means a boom.  Bob did cite the high consumer confidence index, small business confidence, and a variety of other factors as support for his overall very positive outlook.

While people may be “confident”, confidence is a state of mind that can change really quickly…and there are dark clouds on the horizon.

For example – wages remain low; consumer debt levels are at historic highs (26% of earnings); the Federal debt and deficit is going to soar, driving up interest rates; and there’s a real risk of trade wars.

If consumers feel strapped and stop buying, things will get ugly. Given the record levels of consumer debt, I don’t see how the buying surge can keep going unless wages increase and interest rates stay low – which isn’t happening.

Bob briefly noted the issue of wage stagnation, but did not discuss the impact of this – and the fact that this is a chronic problem for consumers and businesses. In fact, the financial gains are not going to workers, but to investors and owners…who are less likely to use their newly-gotten tax gains and profits to buy pickups and groceries and movie tickets.

He talked about job openings, specifically the 6 million job openings today – perhaps those jobs are open because employers aren’t willing to pay enough to get people who have left the workforce back in the job market.

He did address the the long-term unemployed, sort of.  Hartwig stated that the number of folks not looking for work is not going to change due to a number of factors (citing the U-6 unemployment rate, which includes those not actively looking for work – slide 17).

Got to admit this was confusing… the overall labor force participation rate, which has been pretty flat since 2014, was often cited by Obama critics as proof that the “recovery” was no recovery at all.  Now we hear that the unemployment rate – which is the inverse of the labor force participation rate – isn’t likely to change. [I emailed Dr Hartwig Monday asking for clarification; haven’t heard back yet but will update the post if I do]

Well, which one is it – will people return to the workforce or not?
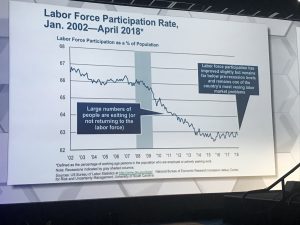
Here’s a detailed discussion of labor force participation rates; note that the rate today is exactly what it was in January 2017 – 62.9%. And here’s why labor force participation is viewed as a better measure than unemployment.  Here too.

Clouds on the horizon

Hartwig did note a few potential issues…

  • the possibility of trade wars affecting employment; those industries most at risk – aircraft, electrical equipment, fabricated metals are among the top potential victims,
  • infrastructure improvements likely won’t have much of an effect.
  • the pending huge increase in the Federal debt  – Bob said that interest rates “may” have to increase.

May???

Not only will interest rates go up (for businesses and the Feds), but a much larger percentage of Federal spending will go to debt service. In fact, we can expect the Fed to increase rates this year.

What does this mean for you?

The data points cited by Dr Hartwig don’t indicate the economy has strengthened appreciably over the last 18 months. Yes, consumer and small business confidence indicators are strong, but they appear to be based not on real economic conditions but on emotion.

Emotions can change fast.


May
22

Swedlow on work comp networks…they are NOT equal

The best was saved for last at NCCI’s Annual Issues Symposium. After Gen (ret) Colin Powell warmed up the crowd, NCCI’s Barry Lipton and CWCI’s Alex Swedlow took to the stage to educate us on networks and outcomes.

First, California. Average medical costs have gone up 4.3x in CA since 1990; while there have been lots of regulatory and legislative efforts to add guidelines, enable managed care, and increase network usage, ultimate medical costs now are over $37k.

Network penetration in CA is now around 84% for physician services – where it looks like it has peaked.  Along with this increase has come an increase in administrative expenses.  WC Admin expense in CA now accounts for 53% of work comp costs, more than twice the average across the nation.

41% of those costs are for med management (31% for defense attorney expense). Bill review and network account for 47% of those medical management costs, UR is the remainder. (these percentages have been pretty static over the last decade).

So, what are you getting for all your millions?

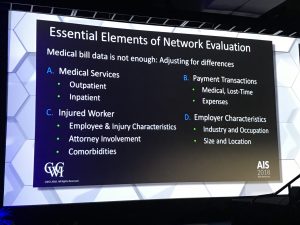
Fortunately, CWCI’s done a lot of work to evaluate that very question. And they dug really deep. The slide below describes the data points CWCI used in their network evaluation.

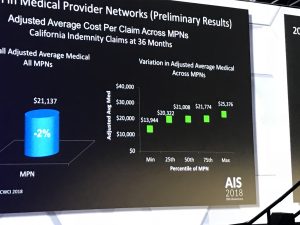
Swedlow et al then looked at individual networks, comparing 11 different networks’ outcomes for claims (case mix adjusted, incurred between 2011-2014, developed thru 2017). Lots of takeways that will be published in a few weeks after final editing.

But here’s a spoiler –

There’s a huge amount of variation between networks, and some are delivering excellent results while others are worse than no network at all.   I direct your attention to the right side of the picture; note that average case-mix-adjusted cost per claim varied by 82 percent.

If you used the MPNs on the left side of the graph, your medical loss costs per claim would be over $11,000 lower than if you used the MPNs on the right.

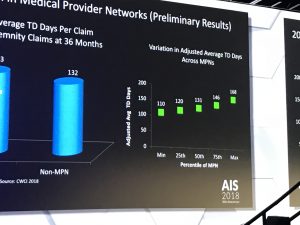
And, your patients would get back to work two months earlier.

My takeaway is this – there are two types of MPNs; the State Fund and Kaiser Permanente On-The-Job type that is outcome-based, highly selective, and focused on care. This Outcome-based MPN, Or O-MPN is on the left of the screen.

And the revenue-based, that are focused on generating dollars off savings below fee schedule and other meaningless standards. On the right of the screen, the revenue-based MPN, or R-MPN, is huge, includes every provider in the book and some who haven’t been in the book for some time, is completely unmanaged, and generates beaucoup bucks for the payers that use it.

Lots of other great insights in the session which I missed – I had to run to get to the airport.

What does this mean for you?

Depends…Is your MPN an R-MPN or an O-MPN?  


May
18

Blockchain’s getting more real in work comp

Kudos to NCCI for including an excellent discussion of blockchain in this year’s Annual Issues Symposium.

(Prior posts on blockchain are here.)

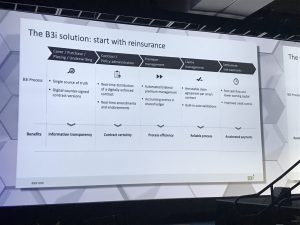
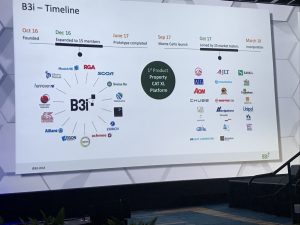
This is starting with reinsurance; a good summary is in presenter Paul Meeusen’s summary slide below.

Meeusen and his colleagues and business partners have moved very, very quickly. Many of the bigger names in insurance, reinsurance, and other service entities came together in December 2016 to figure out if and how to work together on blockchain.

Now, less than 18 months later, a company is working to set standards, coordinate communications, and define working processes.

Rather than get into the nits of this, I’ll focus on impact.

Remember – P&C insurance’s administrative expense load is stupid high.

And work comp is perhaps the worst offender; about 30% of premiums go to stuff other than paying claims. That administrative expense is, in the view of blockchain advocates, proof that WC is very inefficient. Therefore there is a significant opportunity to strip out costs while improving data quality, speeding up transactions, and reducing employers’ and taxpayers’ expenses.

The business case for blockchain – which I’m using here as a description of a broader use of technology to replace today’s cumbersome, error-prone, and high-friction administrative system – is so compelling as to render it inevitable.

It also means there are going to be a LOT more opportunities for consumers to insure things that are valuable to them – objects, events, structures, trips, you name it.

What this means for you:

  • Many of us who are “frictional cost” are going to lose our jobs.
  • Service companies who make their money doing admin work are going to lose their customers.
  • And other vendors, especially small ones who can’t afford to adapt to blockchain, are going to find they can’t service their customers.
  • But there are great opportunities for creative insurers to find new niches to service customers.


May
17

Opioids, marijuana, pain, and workers’ comp

NCCI’s Raji Chadarevian discussed opioid utilization, price, and cost at NCCI’s AIS 2018.

6 percent of opioid medications used in workers’ comp is for treating opioid use disorder; methadone and suboxone are the drugs of choice.

The older the claim is, the more opioids are prescribed. For 15 year old claims, about 2.5 oxycodone pills were prescribed per day. As a result, claims that are more than 10 years old accounted for more than 50% of all oxycodone pills. And, the top 10% of users consumed 79% of pills.

Those heavy users also get a lot of other medications to help them deal with side effects of opioids (and other conditions). These users get about 7 non-opioid scripts for every 10 opioid scripts.  These drugs include gabapentin, benzos, and muscle relaxants.  Fortunately, Raji reported that there’s been a change over time as prescribers have shifted to non-benzo anticonvulsants and made other changes to reduce health risks.

Raji handed the mic off to Dr David Deitz (good friend and colleague). Dr Deitz gave a trenchant and informative description of marijuana, noting that way more is not known about marijuana’s (and its included compounds’) effects on humans than we do know. Some of the effects are reduced anxiety, reduced inflammation, euphoria, appetite stimulation and others you may have experienced yourself.

Dr Deitz then reviewed the state of the science on cannabis – there is substantial evidence of benefit for the treatment of chronic pain and the treatment of nausea due to chemotherapy.  Moderate benefit for anxiety, sleep loss, and appetite/weight loss due to HIV/AIDS has been found.

Evidently there are a lot of restrictions on research into marijuana by the FDA – some seem nonsensical.  These restrictions are screwing up research, and perhaps leading to wrong conclusions.

For work comp, cannabis may be useful as an adjunct, or secondary treatment for:

  • Chronic pain
  • Anxiety
  • Spasticity related to spinal cord injuries

Couple other key points.

Opioid mortality and the use of opioids for Medicare and Medicaid patients both declined in states with legalized use of marijuana.

58% of voters support legalization of marijuana, and 70% oppose enforcement of federal laws in states that have legalized marijuana.

The net – we don’t know much about cannabis, but we do know it absolutely helps in certain conditions, and most folks want it legalized.


May
17

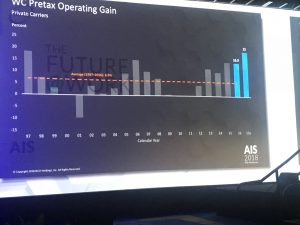
That’s the first top takeaway from NCCI’s Annual Issues Symposium.  Over the last 30 years the average pretax operating gain has averaged 5.5%; last year the return was more than four times higher.


The big news came from Kathy Antonello, NCCI’s Chief Actuary. (the bullets below are derived from different data, complete presentation is here). Note “NCCI states” does not include several large states; California, New York, Pennsylvania, Ohio, and others.

  • Claim frequency dropped precipitously – 6 percent, on top of last year’s 6.2%…over the last 20 years, frequency drops 3.7% per year (for carriers and state funds in NCCI states).  According to Antonello, “barring major unforeseen events, we do not expect this trend to change.” (I may have slightly misquoted her) Private carriers’ work comp premiums declined marginally…adding State Fund premiums still resulted in a marginal decrease.
  • WC combined ratio for private carriers improved to 89 – the lowest result in over 50 years.  That is a pretty amazing number.
  • Two big states – FL and NY – saw premium increases north of 9% (rates are available for all states)
  • Medical inflation for lost time claims increased 4 percent for funds and carriers in NCCI states.

A couple underlying stats reveal much more.

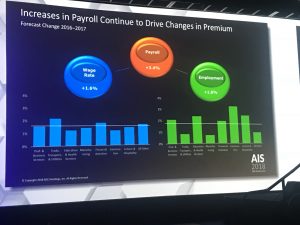
Comp premiums are driven by payroll and losses; payroll jumped 4.4 percent, while loss costs dropped by 4.2%. So, despite more pay to more workers, losses stayed flat.

Put another way, the frequency decline more than offsets increases in employment. So, the total number of claims likely declined significantly.

The result – filed premiums in the vast majority of states decreased last year, so most employers’ costs are decreasing. And, this may continue, as reserves are in very good shape, so insurers won’t have to raise rates in future years to build up reserves for past claims.

Finally, Kathy’s presentation was terrific. Great use of graphics, videos, and slides to communicate some pretty complicated and dense information. Kudos to the folks behind the scenes who developed the data, put together the graphics, and made it all understandable.

I’ll give my take on what this means next week; suffice it to say that this is:

  • great news for employers and taxpayers,
  • bad news for case management and other claims-centric businesses, and
  • going to force insurers to think very carefully about future capital investments.

There is a wealth of information in the presentation, SSDI and work comp, residual markets, BLS v WC claim rates – download it here.


May
4

Fast facts about work comp pharmacy

We’re pushing to finish CompPharma’s Annual Survey of Prescription Drug Management in Workers’ Comp next week. After cleaning up the data, we’ve got final figures.

Quick takeaway – we workers comp types are doing a MUCH better job controlling drug usage than the rest of the world  – and MUCH MUCH better controlling opioids.

Here are a few key data points:

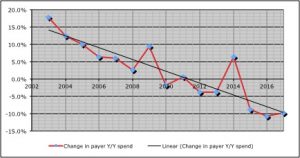
  • Total drug spend was down almost 10 percent last year; drug costs are down 22 percent over the last six years
  • In contrast, other payers’ spend dropped 2.1%.
  • Opioid spend decreased by a third over the last two years.
  • Other payers’ opioid spend dropped by less than half that – 14.9%.

While decreases in opioid spend have been dramatic, payers are still extremely concerned about opioid consumption – especially among long-term patients.

There’s a widespread and deep concern among respondents (29 payers of all types) that we’re a long way from figuring out how to help long-term opioid users reduce/eliminate their drug consumption.

This year we dug deep into that issue, and one key takeaway is the current regulatory focus on formularies and utilization review is focusing on a problem – initial prescriptions of opioids – that, while not solved, is much better controlled.

Where payers, patients, prescribers, and PBMs need regulatory help is with chronic opioid patients. Respondents had a raft of suggestions…

  • mandatory urine drug testing done by labs not affiliated with the prescribing physician
  • prescriber documentation of improvements in pain and functionality required before continuing dosing
  • allow payers to reimburse for opioid recovery services while eliminating responsibility for non-opioid related psychological issues

What does this mean for you?

Work comp isn’t known as an innovative or progressive – yet here you are, well in front of other payers and work comp regulators.

Well done.


May
1

The Reed Group’s attack on WCRI

Reed Group‘s current attack on WCRI is unwarranted, misguided, and out of line. Several Reed employees have publicly chastised WCRI for a variety of sins ranging from poor quality research to a lack of concern about worker outcomes.

Reed’s frustration with WCRI first came to my attention in a post by Reed’s Carlos Luna a couple months back; Carlos said “I find it curious how WCRI, perhaps due to industry demand, focuses on one product (WLDI’s ODG).”

It’s not curious, Carlos.  Much of WCRI’s research is driven by regulators looking for an independent, credible, analysis of potential changes. They ask, WCRI delivers.

More recently, a Reed researcher said that methodological concerns with one of WCRI’s studies (on opioids and disability duration) call into question ALL of WCRI’s research.  In this morning’s WorkCompCentral Elaine Goodman quoted Reed Group’s Fraser Gaspar:

“Based on the substantial limitations and errors in their [WCRI’s] most recent opioid research paper…it is clear that their current review process is insufficient…[WCRI’s] information that does not meet basic research standards”

I strongly disagree.

Gaspar is claiming that WCRI should use blinded reviewers; that is, reviewers should not know that the research is coming from WCRI as that might bias their perspective. Couple of points here:

  • WCRI uses outside experts to review all of its published research; I’ve helped a couple of times and I know many others who have as well.
  • I know of NO other credible research entity involved in work comp that uses blinded reviewers. Does that mean the research by CWCI or NCCI is not credible or doesn’t meet “basic research standards?” Of course not.
  • I have strongly disagreed with WCRI in the past, and they not only listened to what I had to say, they asked me to participate in a webinar to discuss my views.

Goodman reported Reed SVP Joe Guerriero “is also concerned that WCRI’s research focuses primarily on workers’ comp costs, with little attention paid to injured worker outcomes or the possibility of cost-shifting to other payers.” [her words, not his]

Quoting Guerriero:

“looking at reduced drug costs to determine the efficacy of any program is far too narrow…” [emphasis added]

Guerriero is mis-directing here; worker outcomes and cost-shifting weren’t within the scope of the study WCRI was asked to do.  

Not to mention WCRI has done quite a bit of research on cost-shifting and case-shifting. Moreover, it is not possible for WCRI – or anyone else for that matter – to figure out if patients  no longer getting drugs via work comp were obtaining drugs via another payer.

And, WCRI has published dozens of research reports on worker outcomes.

While I understand Reed’s frustration that most regulators are focusing on ODG, the fact is for years ODG’s publisher has been a much more effective marketer than Reed. In addition, the binary nature of the ODG formulary is simple to understand and relatively easy to implement.

FWIW, I’ve long viewed ACOEM’s (affiliated with Reed) approach to guideline development and it’s formulary as more rigorous and more patient-centric than ODG’s. I still do.  I’ve been a fan of ACOEM’s clinical guidelines for years. Their methodology, diligence, and professional dedication to the right care has always impressed. Yes, it’s more work, but it’s better for patients.

But that’s beside the point.

WCRI has always been open to collaboration and conversation. I would encourage Reed to work with WCRI and not cast aspersions about WCRI’s research.

[note – I’ve long been impressed with Elaine Goodman’s reporting and pursuit of the details necessary to provide a complete picture. Kudos to Elaine for an even-handed piece]

ed note – NO REPUBLICATION OR EXCERPTING OF THIS POST IS ALLOWED WITHOUT EXPRESS WRITTEN PERMISSION FROM JOE PADUDA.

copyright 2018, Joe Paduda, all rights reserved.


Apr
10

Everything you need to know about WC managed care regs

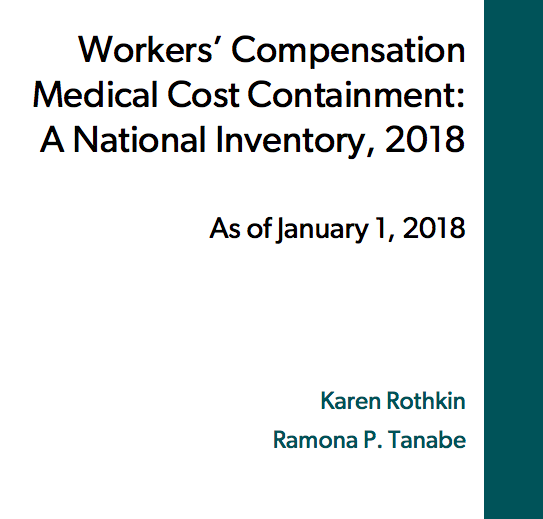
Is now available from WCRI with their latest compendium of Cost Containment Initiatives.

The annual report is a must-have for anyone working in the business in any capacity.

A few interesting notes for those not already immersed in the intricacies of comp regs…

  • Only five states don’t have non-facility provider fee schedules.
  • The vast majority of these fee schedules are RBRVS (Medicare) based
  • There is wide variation among the states – a  lot of this variation appears to be based on factors other than logic or reason.
  • Eight states do NOT have fee schedules for drugs; most are AWP-based but several are U&C; California uses Medicaid.
  • While most states have pretty tight inpatient fee schedules, outpatient is a different story. There’s wide variation and many look to be rather…flexible. Same is true – but even more so – for ambulatory surgical centers.
  • The description of employer/employee choice of treating physician is comprehensive and detailed.  Suffice it to say that the old saying “when you’ve seen one state, you’ve seen one state” is accurate indeed.

Kudos to WCRI’s Ramona Tanabe and Karen Rothkin for doing the work to put this together – so we don’t have to!


Mar
28

919,400 people aren’t working because of opioid use

My best guess is about a quarter of those are work comp patients.

Opioid use disorder (OUD) drains the workforce of qualified, experienced workers, costing our economy $40 billion.

Healthcare costs for OUD alone were $28 billion in 2015 – and all but $2 billion of that was paid by insurance – mostly Medicaid (which is taxpayer funded).

If you are 50 or younger, you’re more likely to die from opioid use than anything else – not a car accident, not cancer, not a heart attack, not diabetes.

Solutions

Medication-assisted therapy (MAT)- using methadone, buprenorphine, vivitrol to help victims get off and stay off opioids – is, for most folks, a key part of recovery. Yet most states have far too few MAT facilities, and many facilities only provide one or two of those medications (not surprisingly, different people seem to do better on different therapies).

Yet there are far too few providers trained and able to provide MAT.  From Inflexxion:

Data shows that less than half of privately funded treatment programs offer any form of medication-assisted treatment. That number falls to 23% in publicly funded programs. According to the 2013 National Survey on Drug Use and Health, of the 2.5 million opioid-dependent or opioid abusing Americans, fewer than 1 million received MAT.

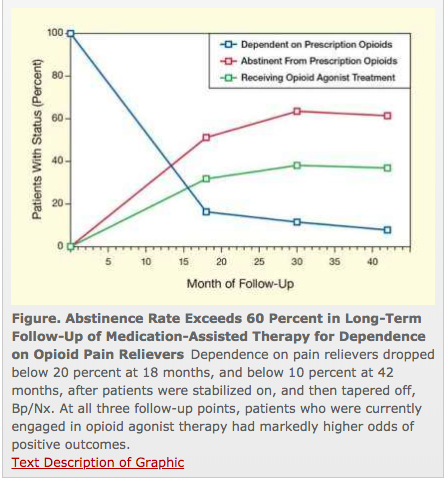
MAT, coupled with counseling and patient-centric, individualized treatment plan can be quite effective.  A solid study found over well over half of patients using MAT were not using the illicit drugs 18 months into treatment – a remarkable success.

However workers’ comp payers are often unable to find MAT facilities, lack the understanding needed to develop a comprehensive, long-term treatment approach, and are loathe to go down that path, as they’re afraid it will make the employer liable for all manner of additional services.

What does this mean for you?

States can and should come up with novel ways of encouraging treatment while limiting future liability.

This will save thousands of lives and billions of dollars for employers and taxpayers.


Mar
26

Value-based care in Work Comp

Randy Lea MD of the Dartmouth Institute (one of the nation’s leading healthcare research organizations, and my personal favorite) just completed research on value-based care (VBC) in work comp – a timely and much-needed project. Dr Lea presented at last week’s WCRI Conference.

Here are my takeaways.

Spoiler alert – value-based care is not getting much traction – and I don’t think it will.

First, the research was more of a survey of what stakeholders want, expect, can do, and think is necessary to bring VBC than a detailed description of what actually exists today. In that way, it’s helpful as it indicates what factors may/will lead to more VBC in work comp.

As much as I respect the Dartmouth Institute and appreciate Dr Lea’s insights, I found the presentation hard to follow. There was just too much information crammed into too little time.

Stakeholder readiness

Providers – only one engaged in a WC VBC pilot program; many were prepared and waiting, but “there’s no opportunity for them to engage at this time.”

Payers – only one is doing VBC – and that is bundled payments. Payers were more focused on high-performing networks, not real VBC. Also doubt the model will be sustainable.

Regulators – again, only one doing VBS, that one has seen positive results, and is ready to expand. access, quality, and are coordination. Not much going on, but many are at least thinking about it.

Now into the meat – their thinking about how VBC might actually occur in workers’ comp.

Conditions that were popular for inclusion in a VBC model included spine, shoulder, knee, CTS, and co-morbidities plus the condition.

First, we need a regulatory environment that is favorable to VBC. No surprise here, although all recommended employer direction, mandated medical treatment guidelines, reduced fee schedules (?!), reduced UR.

Second, providers need enough patients.

Third, there was a lot of concern around RTW, causation, and impairment and who is involved and how decisions around those key issues will be made and on what basis.

Development guidelines

  1. Need a set of values that are shared by the stakeholders that guide development
  2. Rewards for good performing providers
  3. Transparency across all stakeholders
  4. Outcomes focused, not discount-driven
  5. Adaptability to current programs and regulatory conditions
  6. Fair and quick reimbursement of providers
  7. Reimbursement based on guidelines and compliance w MTG
  8. Eliminate fee schedules
  9. Need real steerage of patients
  10. Tight definition of outcomes is mandatory, need real specificity around things like RTW.

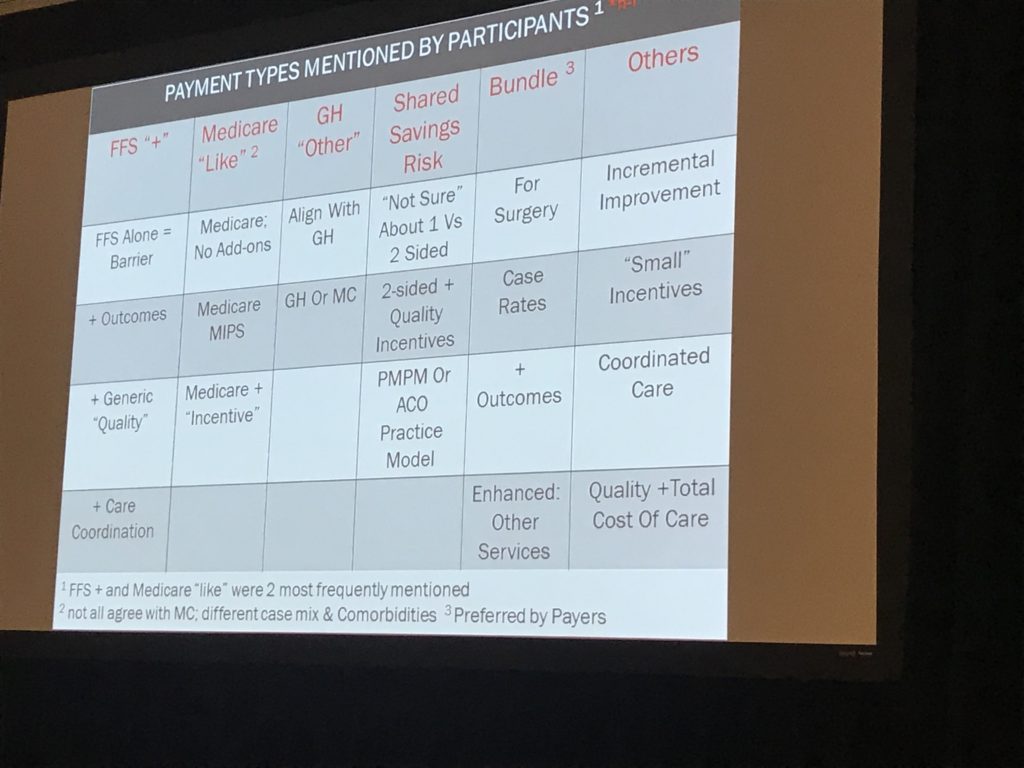
Payment types – participants reviewed a variety of types of reimbursement, with most payers looking for bundled payments  – no surprise.


I also have to note that my main takeaway was thiswork comp is a couple of decades behind the rest of the world – and it isn’t catching up. If anything, we’re falling further behind.

I say this because this is some pretty basic stuff compared to what we see in Medicaid or Medicare.

My view is there are any number of reasons VBC is not going to happen in WC.

  1. There are not enough cases; providers won’t be interested in risk-taking if there aren’t enough cases to spread the risk.
  2. Providers don’t have to take risk; in many states there’s no or limited employer direction, so no guarantee they’ll get a minimum number of cases.
  3. Litigation – providers may have to provide documentation and perhaps testify, something no one wants to risk.
  4. Payers are far too wedded to the percentage of savings profit machine.

What does this mean for you?

Bundled payments aren’t really value-based care. And even those are few and far between, for good reason.