Dec
15

COVID – quick takes on the latest research

A solid study found that the US infection rate is likely way higher than the official reports. The brainiacs at The Economist estimate almost one in every five of us has had the disease.

Coincidentally, I was talking with a client yesterday about his bout with what sounded a lot like COVID. Turns out his wife had it as well.  This is just one of several stories I’ve heard from folks who got sick as far back as last December or January.

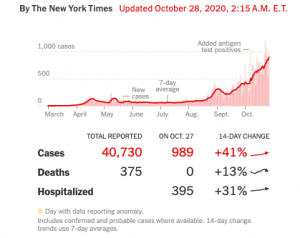
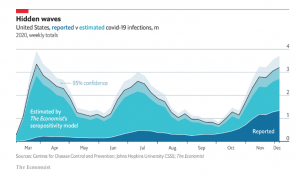
The Economist has a very well done COVID tracker that provides data on excess deaths during the pandemic era, as well as a description of potential reporting issues and causes.

Before you scoff, read the article; the evidence is compelling that the pandemic has led to many more deaths than expected.

A study examining hospital readmission rates for COVID patients found more than a quarter died or returned to the hospital after their initial discharge. This sounds pretty high, but it is actually lower than longer-term death and readmission rates for heart failure and pneumonia patients.

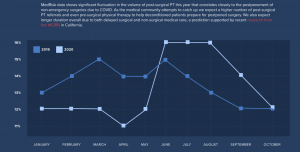
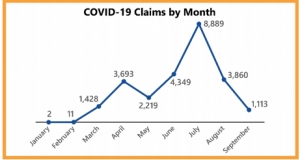
Thanks to WorkCompWire for the piece on CWCI’s report on claims for public self-insureds for the fiscal year ending June 30, 2020. Recall that COVID hit California in early March, so the reports’ findings reflect 8 months of a “normal” year and 4 pandemic months.  Top takeaways:

  • Claim counts dropped over 6%
  • Indemnity expenses zoomed up almost 17%.

My view – it is highly likely the pandemic drove increased disability duration as patients couldn’t access care, facilities postponed elective procedures, and newly-injured workers found it harder to get appointments.

You’ll likely hear much more in a few months if you Save the Date for CWCI’s Annual Conference – on Thursday, March 11, 2021 the brilliant minds and best-presenters-in-the-industry will once again inform and enlighten.  Details forthcoming…topics to include a discussion on how the industry reacted to COVID and the results of current research.

Sticking with workers’ comp, a Kimberly George/Mark Walls piece in National Underwriter noted TPA Sedgwick has handled:

45,000 COVID-19 workers’ compensation claims for their clients. 78% of those are closed with an average paid of $1050. 54% of the claims had no payments made.

That’s pretty consistent with findings from my firm’s June 25 survey of 35 payers and service providers (summary report download at no cost); from an interview back in June:

a lot of claims are filed with no payments…[a] respondent stated “96% of claims cost less than $3,500, but 4% are expensive.”

Finally, the news that Moderna’s vaccine will likely be approved for use this week is excellent news indeed. The company participated in Operation Warp Speed, the Trump Administration’s effort to jumpstart vaccine development by funneling $18 billion in taxpayer funds to organizations and companies working on vaccines.

One of the most positive signs is Moderna’s vaccine showed equal effectiveness among white and non-white subjects. As COVID has been particularly devastating in communities of color, this is critically important.

This from the NYTimes:

There was also no significant difference between its protection for men and women, or between healthy volunteers and those at risk of severe Covid-19 who had conditions like obesity and diabetes. For people 65 and older, the trial provided an estimated efficacy of 86.4 percent, lower than the overall estimate of 94.1 percent. But the apparent difference was not statistically significant.

So far, two potential differences between the vaccines have emerged from the F.D.A.’s reviews, but the findings may [emphasis added] reflect a shortage of data rather than genuine differences. The Pfizer-BioNTech trial showed that their vaccine started to protect against the coronavirus within about 10 days of the first dose. The trial of Moderna’s vaccine, by contrast, did not reveal such a striking effect after the first dose.

What does this mean for you?

Wear the mask and be very careful. This is  very far from over.


Dec
10

Florida’s solution to hospitals’ financial mess is…

To hear hospital lobbyists talk, you’d think Florida’s taxpayers and employers should subsidize hospital losses by paying exorbitant amounts for hospital care.

Yesterday’s virtual meeting of the State’s Three Member Panel (TMP) featured several hospital lobbyists and officials waxing poetic over proposed changes to workers’ comp facility reimbursement, citing the changes’ “fairness”, describing the TMP’s proposal as a “win-win” and the proposed changes as “reasonable”.

Ha.

After Hoovering hundreds of millions out of taxpayers’ and employers’ wallets for years, some hospitals want to continue forcing those taxpayers and employers to pay rates that are often 8 to 12 times what Medicare pays.  They cited an NCCI analysis that purported to show big system savings.

Unfortunately the analysis itself appears to be a state secret as it hasn’t been shared…so no one except NCCI and the Three Member Panel know what data was used, what time period it covered, the methodology employed, or anything else. That’s unfair to NCCI and to every stakeholder, unwise politically, and unhelpful as parties who like the finding can’t cite specifics, and parties that don’t like it can dismiss it outright.

What these hospital advocates didn’t discuss was the basic unfairness of Florida’s work comp physician reimbursement. WCRI data indicates the State’s docs, PTs, OTs, chiros, and other clinicians get paid less than their colleagues in every other state in WCRI’s report. The changes proposed by the TMP would increase providers’ reimbursement by a whopping 0.9%.

As WorkCompCentral’s Will Rabb reported in an excellent summary of the call,  the TMP is somewhat limited by statute, a challenge noted several times by Ass’t Director, Dept of Workers’ Comp Andrew Sabolic. However, Mr Sabolic’s words to the effect that it isn’t possible to define or determine “reasonable” (a statutory criterion for determining reimbursement) are puzzling. I’d suggest an analogy might be helpful (wish I’d thought of this while testifying on the call yesterday…)

Think of it this way; you pull into a gas station – which doesn’t post gas prices – in your personal car, fill up, and only after you’re done do you find out what you have to pay.

If you pulled into an HCA station, you’re going to pay about 8 times what the driver in front of you who filled up their government-issue car pays.

Under the per-diem plus outlier scheme that is kind of/sort of in place today (although many payers are basing reimbursement on a Court ruling essentially eliminating outlier payments) HCA – and some other mostly for-profit hospitals and health systems – get paid 8+ times Medicare rates.  And that was based on data from 2016; I’d suggest that it is highly likely you are paying even more today.

By any “reasonable” definition that is wildly “unreasonable”.

(A detailed discussion of this is here and here is an excellent report by Johns Hopkins researchers on Florida facility costs (non-subscribers to HealthAffairs have to buy it, but the summary is free)

I won’t get into the bizarre multiplier scheme proposal; suffice it to say that it is unique, hasn’t been used in any other state, is not based at all on what it actually costs a hospital to deliver services, and is completely game-able; any hospital can increase their reimbursement by a factor of 5 just by increasing their charges.

I will note that many hospitals don’t wildly overcharge work comp payers; many – but not all – not for profit facilities get paid less than 3 times Medicare.

What does this mean for you?

How is this “reasonable”?

If you want more info on why some hospitals are supporting this scheme, see here.

The TMP will meet December 17 to discuss implementing the changes; you can register here.


Dec
8

COVID and work comp: delays in treatment = delays in recovery

Almost 400,000 surgeries (of all types) were cancelled each week during the 12-week COVID peak this spring. 

In North America, almost 1.2 million orthopedic surgeries were cancelled – the vast majority in the US. Across all countries, the orthopedic cancellation rate was 82%, the highest percentage of any type of surgery.

Assuming a 20 per cent increase in baseline surgical volume, the researchers estimated:
it would take countries a median of 45 (range 43–48) weeks to clear the backlog of operations resulting from 12 weeks of disruption due to COVID…
While surgical procedure volumes undoubtedly increased this summer, news reports indicate elective procedures are once again being postponed in Massachusetts and many other states.
Implication – claim durations are going to increase as patients requiring surgery are back on the waiting list. 
Even after elective procedures return, many patients will face weeks of therapy before they recover and return to full functionality.
Which leads us to PT.
The good news comes from MedRisk, a physical medicine management firm. Their annual Industry Trends Report shows post-surgical PT ramped up quickly this summer – after the COVID peak. (MedRisk is a consulting client)
The company also opined that the delay can complicate recovery because patients become “de-conditioned” while waiting months for surgery, although the delay can be mitigated by “pre-conditioning” patients with pre-surgery PT.
What does this mean for you?
These times are different and require different approaches to ensure rapid and complete recovery. “Pre-conditioning” may help your patients come out of surgery in better shape and feeling stronger…yes it’s different, and new, and a bit uncertain – but these times demand flexibility and creative approaches. 

Dec
2

COVID and workers’ comp…where are we?

It’s time to dig back into how and where COVID is affecting workers comp. As this is very much a state-specific situation, we first need to understand what’s happening around the country.

That’s difficult at best.

(if you just want key takeaways, scroll to the bottom)

For starters, it can be quite difficult for a worker to get coverage for COVID; in most cases a worker must:

  • have a positive PCR test or a COVID diagnosis by a physician, and
  • be an “essential worker”, and
  • work in a state with some level of presumption.

Tests were hard to come by – and many were inaccurate – back in the initial March – to – May wave. Presumption laws have been a moving target and are subject to interpretation, as is the determination of who is – and is not – an “essential worker”.

Okay, the data… 

States’ data below are NOT directly comparable; states report things differently and totals are from different time periods. For example, Florida’s data includes only lost time claims that have been accepted or denied. California, Hawai’i, and New York include all claims filed. Can’t tell much from PA’s data…

Remember, occupational disease is NOT handled the same as an occupational injury; in laymen’s terms, in most cases the burden of proof is on the patient to show COVID was contracted in the workplace and not at home.  This from Florida statute:

“occupational disease” shall be construed to mean only a disease which is due to causes and conditions which are characteristic of and peculiar to a particular trade, occupation, process, or employment, and to exclude all ordinary diseases of life to which the general public is exposed, unless the incidence of the disease is substantially higher in the particular trade, occupation, process, or employment than for the general public.

California

CWCI’s reporting of COVID and related data is timely, robust, and accessible. As of November 30 – 2 days ago – there were 56,854 claims reported. Almost 19,000 were among healthcare workers and 7,700 suffered by public safety and government employees.

note the light blue indicates projected total claims; dark blue indicates reported claims

A lot of claims incurred in November aren’t included in those figures as they aren’t officially reported yet. So, looking at projections for the period ending October 31, CWCI projects there will be a total of 58,136 COVID claims.

68.1% of claims that have been assessed have been accepted, a rate higher than in most other states.

Overall, claim counts are down 12.9% for the year; that’s a loss of one of every eight claims.

New York

Over 12,000 COVID-related claims were filed, as of October 8,  the vast majority still pending.  To date, about 8,000 of the claims filed are lost time, 184 are receiving indemnity payments and another 5,000 claimants received “voluntary” wage replacement payments from insurers/their employer.

Around 1,230 claims were initially denied…and again, about 3/4ths are still pending.

Hawai’i

On the other side of the country, only about 400 claims have been filed in Hawai’i through October. About half were initially denied, and most are still under consideration. Not surprisingly, a plurality (166) were from healthcare or social workers.

Florida

As of October 31, the Sunshine State has accepted or denied 23,000 COVID-related lost time (LT) claims filed, 13,000 have  been ruled compensable and the rest denied. Key findings include:

  • COVID claims account for 31% of all LT claims filed but only 8% of payments
  • Paid amounts to date show 94.6% of COVID claims cost <$5,000
  • 6 claims of the 23.452 have resulted in benefit payments over $500,000; the average is $800,000
  • the average benefit paid for all closed COVID LT claims is $1,092.

Pennsylvania

PA had 9,510 COVID-related claims as of 11/29/2020;  no indication if those are filed, accepted, include all claims or not.

Texas

Our friends on the border reported 25,571 claims as of September 27, 2020 – the vast majority have not been accepted or are still being adjudicated. Similar to other states, Texas’ data indicates an early peak in April followed by a much higher one in July. Notably there are no data for the last two months.

Although Texas’ Division of Workers’ Compensation refers to the reporting entities as “insurance carriers”, the data actually include self-insured employers’ results.

  • Over a third of claims included a positive lab test for or diagnosis of COVID, but less than half of those were accepted by the insurer/employer (14% are still under investigation)
  • Half of all claims were incurred by workers in healthcare or social service, or first responders
  • The 2,065 accepted claims have driven $4.44 million in medical payments (as of September 27). That number, an average of $2,170 per patient, will certainly increase.

There are a bunch of other states reporting COVID claims, a vast improvement over what we had earlier this year. However, the different criteria used, different timeframes, different claim types and data provided make it difficult to get a clear picture of just how many claims have been reported, accepted, and denied; how many are med onlies vs lost time, how costly they are and on and on.

Key takeaways

  1. My best guess is between 200,000 and 300,000 COVID claims were filed by October 31.
  2. Going way out on a limb here, it looks like about a third have been or will be accepted.
  3. Benefit costs remain pretty low – significantly lower than other indemnity claims – although that opinion is based on slim data about claims still open.


Nov
30

Holiday catch-up

Hope your holiday was excellent, and above all safe. Had a very small family gathering here in New Hampshire; brined turkey was deliciously moist.

Okay, back to work; here’s what I found in the inbox.

Congratulations to Kathy Antonello; she will take over as CEO of Employers Holdings early next year.  An actuary by education and former Chief Actuary at NCCI, Kathy is very knowledgeable, deeply experienced, and an excellent communicator. I’ve always been impressed by Kathy, good news for all that she is ascending to a leadership position.

Hospitals are hurting

Elective services have plummeted as patients seem to be avoiding medical facilities. Orthopedics suffered the most; admissions during the first two weeks of October were down almost 15% from the two weeks prior.

It is all but certain things have gotten worse over the last six weeks.

Implication – patients are avoiding treatment for musculoskeletal conditions.

Over the last decade, 134 rural hospitals have closed, with Texas leading the way with 21 closures followed by Tennessee with 14.

Implication – Problems accessing care will result in poorer health and higher mortality for rural folks.

Research roundup

CWCI’s latest  Bulletin (available to members only) reports the Golden State:

  • accounted for 12% – one of every eight – US jobs covered by workers’ compensation; and
  • 19.5% – almost one of every five – dollars of benefits in 2018.

If you are curious why everyone pays a lot of attention to California – now you know.

By the way, New York was second with $6.3 billion in paid benefits with Florida earning bronze with $3.6 billion.

Kudos to Alex Swedlow and colleagues for the heavy lifting on this; CWCI’s folks extracted the data from the National Academy of Social Insurance’s annual WC report. (I am a member of NASI but did not have anything to do with the report.)

Thanks to WorkCompWire for letting us know the fine folk at WCRI published their latest on the impact of early PT for low back injuries; WCRI is hosting a webinar on the topic December 17; sign up here.

Top takeaways, early PT is associated with:

  • shorter disability duration
  • lower medical costs
  • lower utilization

Implication – get low back pain patients into PT as quickly as possible.

Coming up this week – COVID status update. Argh.


Nov
6

Friday catch up

Election week in America – the never-ending show continues…

Here’s what else happened this week.

Online registration for the CompLaude awards opened up; you can sign up here for the December 3 virtual event. Congratulations to all the nominees.

The fine folk at WCRI continue to pump out relevant research; I have a lot of catching up to do but did manage to dive into their analysis of New York’s work comp systems and the results thereof. Quick takeaways:

  • Medical inflation has been pretty flat since 2014, driven by decreasing costs for non-hospital providers. You read that right; costs dropped by about 1 percent per year from 2014 – 2019.
  • Hospital outpatient payments per claim went up 2 percent per year over that period
  • Drug costs in the Empire State have dropped by 9 – 12 percent per year, driven by
  • a 48% drop in morphine equivalents per claim, and a 23 point decrease in the percentage of claims with an opioid script.

Way to go New York.

Addiction treatment

A great piece in WaPo about contingency management, a treatment approach that is yielding promising results. Essentially it rewards drug users with money and prizes for staying abstinent. Some folks don’t like it on moral grounds; they feel its wrong to reward addicts for staying clean.

I’m no ethicist, but this strikes me as a reasonable objection. However, it has to be balanced against the good that comes from helping people recover. Critics’ high morals kind of pale in comparison to keeping people alive.

For now, only the VA is paying for this. It’s long past time private insurers and Medicare/Medicaid stepped up.

All things COVID

I haven’t been paying nearly enough attention to the eruption of COVID; will do a couple posts next week to catch up.  In the meantime, here’s treatment news.

From MedScape, good news; it appears the risk of cardiovascular problems in young athletes recovering from COVID isn’t as high as once thought.

Okay, that’s the good news. The not-good news is the most common version of the virus has mutated and is now more contagious. However, we appear to have dodged a bullet – this version of the virus also mutates much more slowly than other common viruses. It’s really hard to attack a virus that’s constantly changing as scientists are constantly playing catch up.  A relatively stable virus means the development of vaccines and treatments should be a lot more productive.

Lastly, there’s been a lot of misinformation that doctors and hospitals are over-counting COVID cases because they make more money. In a word, that’s a lie. Hospitals do not receive extra funds when patients die from COVID-19. 

Miscoding patients and deaths would be fraud and could result in criminal prosecution.

For the relatively small percentage of patients that don’t have health insurance, there is Federal money available, HOWEVER, healthcare providers can only submit claims that list covid-19 as a patient’s primary diagnosis. Patients with COVID often die of sepsis and other conditions; in those cases providers get paid nothing.

Net – there is zero evidence to support that assertion. None whatsoever.

I find this incredibly offensive; one of our daughters is a nurse working in a major hospital and her husband is a clinician at a VA facility. 1700 healthcare workers have died of COVID – 200 of them are nurses.

These lies are reprehensible.


Oct
28

The Sturgis Superspreader Event

Increasing evidence points to August’s Sturgis motorcycle rally as a major contributor to the big increase in infections throughout the upper midwest.

With 400,000 folks spending days talking, drinking, eating, recreating, socializing, dancing, singing, and generally having a great time – mostly without masks, sanitizer and obviously with no social distancing, this should come as no surprise.

Sturgis’ Meade County has experienced a major jump in case infection rates, helping to steepen South Dakota’s infection curve.

Using phone tracking data, researchers found:

counties that contributed the highest inflows of rally attendees experienced a 7.0 to 12.5 percent increase in COVID-19 cases relative to counties that did not contribute inflows.

Sturgis’ location in South Dakota was problematic as the state has done little to encourage responsible behavior, choosing to allow individuals and local entities to decide on public health measures.

The study has been met with some criticism, however other reports indicate outbreaks linked to Sturgis attendees happened in Colorado, Minnesota, Washington, New Jersey, North Dakota and other states.

One can argue about the validity of this study or pick apart specific issue, but one cannot justify 400,000 maskless people mashing together in the midst of a pandemic.

None of us like to be told what to do – me included. The idea of someone telling me what to wear, where I can and cannot go, things I can and cannot do…is why I’ve worked for myself for 25 years.

With that freedom comes responsibility, and the freedom-loving folks who went to Sturgis likely robbed thousands of others of their freedom to live COVID-free.

What does this mean for you?

We are all in this together – for good or ill.

Thanks to Pete for inspiring this post.


Oct
27

More hospital consolidation = higher prices

The only demonstrable impact of facility consolidation is higher prices.

There’s also solid evidence that more concentrated health care markets are associated with lower health care quality.

While the number of deals dropped by about 21% in the first half of this year as everyone’s attention focused on COVID and the impact thereof, a number of transactions still took place.  Conversely, several deals in process totaling around $23 billion were abandoned, victims of a variety of challenges.

Consolidation may actually accelerate as facilities hammered by the financial impact of COVID19 seek safe harbors.

The latest consolidation is in the north-central part of the nation, with 2 not for profit systems working on an a deal driven in large part of a desire to help the systems expand their footprint.

I’d expect more, although the increasing number of facility closures may well put a damper on deals as some run out of time.

This is particularly damaging in rural areas, where over a hundred hospitals have shut their doors over the last decade.

From Bob Shepard, UAB

What does this mean for you?

There will be fewer hospitals tomorrow than today, which likely means higher prices.


Oct
22

COVID update – where we are today v2

Had a posting issue yesterday; email notifications did not go out to all subscribers – reposting this  – apologies if you already received this.

A big increase in coronavirus infections is here, one that may eclipse the first two waves that struck the country, swamping schools, businesses, governments…all of us.

from JHU, based on Covid tracking project data

In some ways, we are in a far better position to manage this wave than we were back in March.

We know that masks and physical distancing (way better term than “social distancing”, which, frankly, is awful) work.

Medical professionals know a lot more about treating people with COVID. This knowledge was hard-won indeed, the price incalculable at 212,000 dead moms, dads, kids, brothers, sisters, dear friends, grandparents, and colleagues.

We know effective contact tracing and quarantine limit the spread, AND make societal shut-downs unnecessary.

In other ways we are little better off than we were in March. Back then the hot spots were limited to a few metro areas in a handful of states; now the biggest spread is in North and South Dakota, Montana (!), Wisconsin, Idaho and Nebraska, with local hot spots in many other states.

It hasn’t helped that COVID has become politicized and science ignored or denigrated.

We are still woefully lacking in the number of tests administered, how fast results come back, and how accurate tests are.

We’re averaging about a million tests a day, which sounds great, until you realize we need more than 6.5 million tests a day.  Worse still, many tests are all but useless as it takes far too long to get results, and there are too many false positives and false negatives.

And the burden isn’t equally shared. We have lost at least 41,583 Black lives to COVID-19 to date. Black people account for 20% of COVID-19 deaths where race is known. (13% of the population) The death rate for minorities – Hispanics and Native Americans in particular – are much higher than it is for Whites.

What does this mean for you?

Wear a mask. Physically distance.


Oct
21

COVID update – where are we today.

A big increase in coronavirus infections is here, one that may eclipse the first two waves that struck the country, swamping schools, businesses, governments…all of us.

from JHU, based on Covid tracking project data

In some ways, we are in a far better position to manage this wave than we were back in March.

We know that masks and physical distancing (way better term than “social distancing”, which, frankly, is awful) work.

Medical professionals know a lot more about treating people with COVID. This knowledge was hard-won indeed, the price incalculable at 212,000 dead moms, dads, kids, brothers, sisters, dear friends, grandparents, and colleagues.

We know effective contact tracing and quarantine limit the spread, AND make societal shut-downs unnecessary.

In other ways we are little better off than we were in March. Back then the hot spots were limited to a few metro areas in a handful of states; now the biggest spread is in North and South Dakota, Montana (!), Wisconsin, Idaho and Nebraska, with local hot spots in many other states.

It hasn’t helped that COVID has become politicized and science ignored or denigrated.

We are still woefully lacking in the number of tests administered, how fast results come back, and how accurate tests are.

We’re averaging about a million tests a day, which sounds great, until you realize we need more than 6.5 million tests a day.  Worse still, many tests are all but useless as it takes far too long to get results, and there are too many false positives and false negatives.

And the burden isn’t equally shared. We have lost at least 41,583 Black lives to COVID-19 to date. Black people account for 20% of COVID-19 deaths where race is known. (13% of the population) The death rate for minorities – Hispanics and Native Americans in particular – are much higher than it is for Whites.

What does this mean for you?

Wear a mask. Physically distance.