May
14
  • Direct written premium was flat,
  • combined ratio stayed low,
  • loss costs decrease, and
  • reserve deficiencies disappeared.

Later this week I’m going to do a series of posts unpacking these findings and opining on what it means for you. For now, here are the key takeaways

The big number – the combined ratio – got a lot better – declining to 83 from 2017’s 89. That is a historically low number.

Here’s the entire presentation.

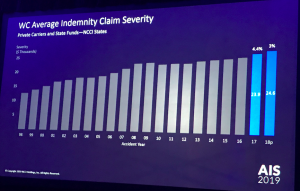
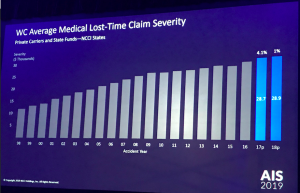
We’ll focus on indemnity and medical expenses for a moment, as these are key cost drivers. Note that these data are ONLY for NCCI states – which don’t include some big states such as New York.

The graph below shows that indemnity claim severity – the cost per claims did increase – albeit modestly.

Medical costs barely increased last year. I’ll have a lot more to say about this in a future post.

Kathy does an excellent job making really complex data understandable while making it relevant.

For example, payroll increased by 5.3% in 2018, more than offset by total loss costs (driven by frequency and claim costs) which dropped almost 9%. The takeaway – claim costs decreases are more than offsetting increases in payroll and employment. That happened despite a big increase in employment in construction, which is a higher frequency, higher severity industry.

The result, only 5 percent of surveyed respondents saw an increase in their WC premium rate this year; almost everyone had no increase or a decline.

Let’s pause here.

This has never happened in workers’ comp. We have never seen this level of financial performance, and it is clear insurers are still trying to figure out why this is happening, when it will end, what will cause a change, and what the warning signs will be.

What does this mean for you?

Life is pretty great right now. We do know it will end.  We do NOT know what will cause that event.


May
13

Explaining pharmacy pricing, part 4

Do you have any idea if you are paying your PBM what you should?

Work comp payers’ PBM pricing is based on AWP; typically it is a percentage below AWP. Brand drugs are discounted 10-16%, and generic pricing is typically below AWP -40% .

The PBM is making its money on the “spread”; the difference between what it pays the pharmacy, and what it charges you.

Your PBM contracts with retail pharmacies, chains, food and drug purveyors (think Walmart), and independent pharmacies. In some cases third party billers are also contracted, along with physician dispensers and mail order pharmacies.

Here’s where it gets funky.

The PBM’s contracted rates with those pharmacies are all over the place and may even vary by region or drug. That’s fine; you are getting a discount, and the PBM is betting it will – overall – make a profit.

That is, it’s fine IF your average discount is equal to or better than what you were promised.

Reality is, very few workers’ comp payers review their PBM’s bills to make sure that the average discount is what they were promised. 

Workers’ comp insurers and TPAs audit claims, case management performance, reserves, bill review, hospital bills, network discounts, legal bills…pretty much everything BUT pharmacy.

The Russians said it best.

That is NOT to say PBMs purposely mess with the numbers/bills/codes to increase their reimbursement. Rather, like any entity, mistakes can be made, lapses occur, updates lag.

Unfortunately, in the audits we’ve seen these errors usually benefit the PBM.

What does this mean for you?

If you’re looking to ensure you’re paying what you should, let’s talk.


May
10

Explaining pharmacy pricing, part 3

Here’s the thing about “list” prices for drugs – the more accurate definition of AWP is “Ain’t What’s Paid.”

The REAL price is what is paid AFTER rebates and other discounts are applied.

That’s why the current media frenzy over drug prices is just dumb; it doesn’t account for the impact of rebates on the actual price you pay.

Reality is, actual prices paid for brand drugs went up by a measly 0.3% in 2018. Consumers benefited from rebate sharing as well, as the average price they paid for brand drugs didn’t go up last year.

That said, the fastest growing part of drug spend is specialty medications, drugs that are injected or for critical diseases such as cancer, hepatitis C, HIV, and autoimmune diseases.

Specialty medications only accounted for 2.2% of all prescriptions, but almost half of total drug spend.

What does this mean for you?

  • Across the board, drug price increases are negligible…for those payers that capture rebates.
  • Rebates are key – if you are not capturing rebates, the price you pay for brand drugs is much higher than it could/should be.
  • Pay very close attention to specialty meds.

IQVIA has an excellent and quite detailed report on drug price and utilization trends – available here.


May
9

Explaining pharmacy pricing, part 2

Yesterday was post 2 of Pharmacy Week at MCM, an intro to drug pricing. Today we’ll get you up to speed on why the list prices for drugs are irrelevant – mostly. 

Recall that almost all work comp drug fee schedules are based on Average Wholesale Price – a metric that is three falsehoods in one, as it is neither “average”, “wholesale”, or the “price”.  Regardless, when calculating the “savings” from a PBM contract, buyers almost always use AWP as the baseline. And that’s what buyers report to their bosses and customers; here’s what we saved below states’ fee schedules…

As we discussed yesterday, brand drug manufacturers pay PBMs (and other entities in the drug supply chain) rebates on their drugs so the PBMs will allow patients to get those drugs without going thru the Prior Authorization process.

That’s quite effective in the commercial health insurance world, where insurers have complete control on what drugs are “on formulary” and drive consumer behavior by setting co-pay amounts. It’s a lot less effective in work comp, where formularies are driven by a) state regulations and/or b) treatment guidelines. In either case, work comp payers can’t encourage patients to use preferred brand drugs by setting the co-pay lower than non-preferred brand drugs.

That’s not to say work comp PBMs don’t get paid rebates for brand drugs – in many cases they do, although the amounts can be a lot lower for comp.  And, PBMs often, and with some justification, use these rebates to offset price reductions.

You’re wondering: “well, how many dollars are we talking about?” I’ve heard different things from different people, from an average of $35 per brand script to $74.  Or, in percentage terms, up to 30%. Those payments aren’t for ALL brand drugs, and it’s highly likely the manufacturers don’t even know they are sending those dollars to work comp PBMs and payers; Work comp is such a tiny piece of total drug spend that most entities don’t bother to track it.

What does this mean for you?

Rebates are being paid to work comp PBMs and payers. Some payers don’t want the rebate payments; they’re afraid those payments could be construed as affecting decisions about medical treatment.

Others look at this as a fiduciary responsibility issue; they want to know so they can better manage their customers’ dollars.


May
8

Explaining pharmacy pricing, part 1

With all the attention being paid to pharmacy prices, it’s time we dug deep into  PBM pricing, rebates, and what this all means to you.

We’ve learned from all the lawsuits, Congressional hearings, media blitzes and punditry is that this is everyone else’s fault.

We’ve heard that Ohio is suing Optum over alleged improprieties related to the state’s work comp and Medicaid pharmacy programs [to be clear, Optum’s Ohio work comp problems arose from Optum’s acquisition of Catamaran, which served BWC. The ensuing debacle was not due to Optum’s work comp PBM.]

We’ve heard testimony before Congress that it’s the manufacturers’ fault, the PBMs’ fault, the gubmint’s fault, employers’ fault.

To unpack the issue we have to begin with the list price of drugs vs the actual price.

And we have to separate brand drugs vs generics;  most of the press about prices pertains to brand drugs. These are medications that are still covered by patents; only the patent holder can sell the drug, and they can set any price they want. In work comp, brand drugs account for about 15% of scripts, but a bit over half of total drug costs; as the manufacturer has monopoly pricing power, that’s not surprising.

(Generics are drugs that have lost patent protection and can be made and sold by any FDA-approved manufacturer.)

In work comp, most states with fee schedules use “Average Wholesale Price”, a metric that is published by several entities- Medispan is one of the more common. It’s critical to understand that AWP is NOT the real “average wholesale price”, it is merely the price the manufacturer sent to Medispan et al. There’s no checking, auditing, or verification of this price by any outside entity; there’s no independent confirmation that the manufacturer’s AWP is what it charges for the pill.

To estimate the actual price, one has to factor in rebates and other financial mechanisms used by manufacturers to market their drugs. Rebates are paid to Pharmacy Benefit Managers – that then pass most of the rebate $$ along to employers and insurers – to encourage the PBM to “put the drug on formulary.” In English, that means the PBM makes it easy and cheap for you, the consumer, to get that medication.

source – Milliman

If a medication is not on a preferred formulary, it will cost a lot more, and you have to go thru the “prior authorization” process to get approval for it.

Clearly manufacturers are highly motivated to get their drugs “on formulary” – and they use rebates to incent PBMs, insurers, and employers to do just that.

So, when calculating the price of the pill, one has to factor in the rebate paid to the PBM/insurer/employer to get to the TRUE price – which is usually a lot less than the published AWP price.

Tomorrow, what this actually looks like – and a few more pricing definitions.

What does this mean for you?

Rebates are critical to understanding pharmacy pricing.


May
6

It’s work comp pharmacy week at MCM

And to kick it off, here are quick facts about work comp pharmacy…

Total workers’ comp drug spend was about $4 billion last year.  Others will argue it’s much higher, after 15 years of digging into the data I’m quite comfortable that figure is accurate.

That’s about 13% of total work comp medical spend  of $31 billion (using NASI’s industry-standard report as the source).

Work comp drug spend has been steadily – and significantly – decreasing for the last eight+ years; my best estimate is drug costs are down about $1.1 billion since 2010.

This remarkable drop has been driven by dramatic decreases in opioid usage and fee schedule changes; PBM consolidation has also been a driver as PBM pricing has declined over the last several years.

Today there are two major WC PBMs, two mid-tier ones, and a host of much smaller companies with little market share.

In 2017, opioid spend declined to less than a quarter of total drug costs, driven by a 30% drop over the previous two years. The even-better news is patients not taking opioids also don’t need to take drugs to mitigate the side effects; insomnia, depression, constipation, erectile dysfunction, etc. And, the knock-on effects on claim duration and settlements are positive indeed.

You can download CompPharma’s latest PBM in WC report here,  all of our 15 surveys are available here.

Tomorrow we’ll dig into pricing and what’s real – and what isn’t – in the media’s coverage of drug pricing.


May
2

The CBO’s Single Payer Report and worker’s comp

The CBO’s 34-page analysis of Single Payer is out, and there are no references to workers’ comp or occupational injuries/illnesses. 

That doesn’t mean there aren’t plenty of ways Single Payer would affect work comp.

Briefly, Single Payer is a very broad term that over-generalizes a bunch of very different approaches to universal health insurance coverage. As defined in the CBO report, in Single Payer programs “people enroll in a health plan operated by the government, and the receipts and expenditures associated with the plan appear in the government’s budget.”

When you recall that work comp accounts for about 1% of total US medical spend, it’s no wonder the CBO report ignores us. But, how Single Payer would affect comp depends on two core issues:

  • whether care for occupational injuries/illnesses is covered by Single Payer, and
  • whether there is a universal fee schedule.

If WC care is included under Single Payer, it is likely work comp would evolve to an indemnity-only system. This currently exists in several other countries, and seems to work pretty well.

If WC medical care is NOT included in Single Payer, the impact would be driven largely by the presence – or absence – of a universal fee schedule. 

Without that universal fee schedule, providers would likely continue to do their revenue maximization thing, although they’d supercharge those efforts. Why? Because reimbursement from all other payers would drop significantly, and providers would look to comp to replace as much of that lost income as possible.

What does this mean for you?

The healthcare system is the elephant, and workers’ comp is the mouse.


Apr
29

RIMS reminders

Morning all!

I’m not attending RIMS, but if you are, a few things to help you survive – and profit from – the week.

1.  Realize you can’t be everywhere and do everything. Prioritize.

2.  Leave time for last-minute meetings and the inevitable chance meetings with old friends and colleagues.

3.  Unless you have a photographic memory, use your smartphone to take voice notes from each meeting – right after you’re done.  Otherwise they’ll all run together and you’ll never remember what you committed to.

4.  Introduce yourself to a dozen people you’ve never met.  This business is all about relationships and networking, and no better place to do that than this conference.

5.  Which leads to help someone out. Yes, you’re incredibly busy and have lots of priorities. Make it a point to listen to someone who looks lost or bewildered, say hello to a student there for the first time, shake hands with a guest from another country.

6.  Wear comfortable shoes, get your exercise in, and be professional and polished.  It’s a long 2, 3,or 4 days, and you’re always ‘on’.

Finally, I’ll echo Sandy Blunt’s advice – in these day of YouTube, phone cameras, Twitter, SnapGram and InstaChat, what you do is public knowledge.  That slick dance move or intense conversation with a private equity exec just might re-appear in a tweet…

overbite.jpg (480×360)


Apr
26

So what?

or the longer version…What does this have to do with workers’ comp?

I hear that far too often, usually when talking with a work comp exec about Medicare reimbursement changes, the number of workers without health insurance, MS-DRGs, Medicaid expansion, health system consolidation, physician employment trends, single payer/Medicare for All.

While many execs appreciate that “external” factors affect workers’ comp, few really understand the implications. That’s a big miss, and leads to strategies based on false assumptions and flat out ignorance.

A telling example…

I’ve been grousing about the “revenue maximization” industry that’s been driving up work comp facility costs for years. By focusing technology, expertise, and highly sophisticated tools, health systems are getting ever more effective at hoovering dollars out of your wallet.

If you need more evidence that we work comp folks are woefully ignorant of and unprepared for this, a just-out article reports there’s a shipload of private equity money invested in the revenue maximization industry – with billions more on the way.

PE firms are looking to double their investment in 3-5 years; these are very smart folk who’ve all done a lot of work to project where things are headed. And they are investing tens of billions of dollars in companies that are laser-focused on increasing facility reimbursement.

The smart money knows we are woefully ill-equipped to stand up to their billing expertise. Other payers use multiple vendors both pre- and post-payment to ensure they are only paying what they are legally obligated to. We are talking payment integrity, deep coding analysis, minute comparison of line items to medical records, accessing huge databases of reimbursement data from Medicare, Medicaid, group/individual health plans to ascertain REAL U&C…

You’ve got, what, bill review and a few nurses manually sorting thru bills?  And you picked your bill review vendor based on the lowest bid and then screwed them down on price even more?

Worse, as other payers continue to upgrade, improve, and generally keep pace with the revenue maximizers, work comp is going to fall further and further behind.

See where this is headed? (Hint – We’re the muppet in the middle)

Finally, there’s this thing called Fiduciary Responsibility.

From the Cornell Law School…

The duty of care requires that directors inform themselves “prior to making a business decision, of all material information reasonably available to them.” Smith v. Van Gorkem, 488 A.2d 858 (1985).

Whether the directors were informed of all material information depends on the quality of the information, the advice available, and whether the directors had “sufficient opportunity to acquire knowledge concerning the problem before action.” Moran v. Household Intern., Inc., 490 A.2d 1059 (1985).

What does this mean for you?

Ignorance, arrogance, or laziness is no excuse. 


Apr
23

Gallagher Bassett’s using data to improve care for work comp patients

What passes for predictive modeling today is like Google maps, except the app tells you when to turn a half-hour after you’ve passed the intersection.

Adjuster finding out a claimant had spinal surgery 6 weeks ago…

By the time adjusters figure out a claim has gone off the tracks, it’s often too late to do anything but increase reserves. That’s because there’s no real-time monitoring, no way to clearly and definitively identify when – exactly – that happens.

A promising approach is in the works at Gallagher Bassett.

Building off research conducted by Johns Hopkins, GB has developed a tool that enables real-time monitoring of medical services delivered to its claimants. Using a proprietary platform, alerts are sent when patients’ quality of care is headed in the wrong direction.

The trigger is inappropriate medical treatments. GB matches medical bill data with evidence-based treatment guidelines, with each service, procedure, or medication individually assessed. As the number of inappropriate treatments increases, alarm bells ring.

Of course, that doesn’t mean all treatment that is non-compliant is inappropriate. However, much is, and there’s a clear – and quite strong – correlation between bad medical care and lousy claim outcomes.

Those are clinical words and hide the real import of GB’s approach. Getting claims back on track means patients get better faster, AND the risk of bad outcomes from inappropriate surgeries, injections, drugs, and tests decreases.

What does this mean for you?

There’s lots of data out there – and far too little smart use of data. This is promising indeed.