WCRI’s webinar on interstate variations in drug payments reminds us that lax regulations and absent legislators cost taxpayers and employers millions.
Slides are here – and are free to access. The report itself is here – available free to members and a nominal fee for non-members.
There’s a ten-fold variation across the 28 states studied by WCRI, with WI MN and MA around $22 in quarterly drug spend per claim, but LA and FL right around $200. A far higher percentage of claimants get scripts in the two high-spend states than in those on the lower end – and I’ll bet most of those are from dispensing physicians and attorney-represented workers using mail-order pharmacies.
WCRI looked at data from non-COVID claims less than 3 years old in 28 states from Q1 2018 to Q1 2021.
Top takeaway – overall quarterly drug payments dropped from $102 in Q1 2015 to $68 in Q1 2021 – but PA FL and CT – states with physician dispensing and/or mail order pharmacy problems – actually saw an increase – and that increase was largely driven by dermatological agents.
Want more evidence of the rampant profiteering enabled by lax regulations and compromised legislators?
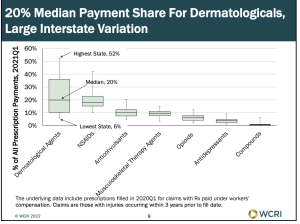
- Dermatological payments account for about 20% of payments in the median state – although there’s a wide variation, from 6% in the lowest state to over half (52%) of payments in the highest state.
- These dermatological agents are almost always combos of lidocaine, menthol, diclofenac sodium and other generics – profiteers mix ’em up and bill at a huge markup.
- PA is especially egregious – the vast majority of these dermatologicals are pharmacy-dispensed, and the average price paid was over $300.
- Physician dispensed drugs accounted for more than half of drug costs in several states including Florida

- It’s not just dermatologicals…California saw a big jump in NSAIDS driven by fenoprofen and ketoprofen…both questionable medications that have become darlings of the physician dispensing/mail order profiteers.
There’s good news too…after dermos, NSAIDs have the next highest payment across all drug groups at 18%…while opioids account for about 7% in the median states – way down from 13% in the same quarter three years ago.
I’d note that this is for claims <3 years old, and likely reflects the successful effort to avoid prescribing opioids to patients better served by other therapies.
What does this mean for you?
PA FL LA and CT – stop screwing employers and taxpayers.


