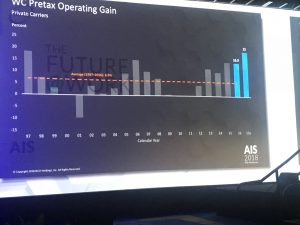
That’s the first top takeaway from NCCI’s Annual Issues Symposium. Over the last 30 years the average pretax operating gain has averaged 5.5%; last year the return was more than four times higher.

The big news came from Kathy Antonello, NCCI’s Chief Actuary. (the bullets below are derived from different data, complete presentation is here). Note “NCCI states” does not include several large states; California, New York, Pennsylvania, Ohio, and others.
- Claim frequency dropped precipitously – 6 percent, on top of last year’s 6.2%…over the last 20 years, frequency drops 3.7% per year (for carriers and state funds in NCCI states). According to Antonello, “barring major unforeseen events, we do not expect this trend to change.” (I may have slightly misquoted her) Private carriers’ work comp premiums declined marginally…adding State Fund premiums still resulted in a marginal decrease.
- WC combined ratio for private carriers improved to 89 – the lowest result in over 50 years. That is a pretty amazing number.
- Two big states – FL and NY – saw premium increases north of 9% (rates are available for all states)
- Medical inflation for lost time claims increased 4 percent for funds and carriers in NCCI states.
A couple underlying stats reveal much more.
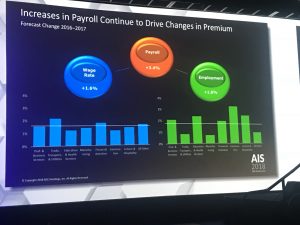
Comp premiums are driven by payroll and losses; payroll jumped 4.4 percent, while loss costs dropped by 4.2%. So, despite more pay to more workers, losses stayed flat.
Put another way, the frequency decline more than offsets increases in employment. So, the total number of claims likely declined significantly.

The result – filed premiums in the vast majority of states decreased last year, so most employers’ costs are decreasing. And, this may continue, as reserves are in very good shape, so insurers won’t have to raise rates in future years to build up reserves for past claims.
Finally, Kathy’s presentation was terrific. Great use of graphics, videos, and slides to communicate some pretty complicated and dense information. Kudos to the folks behind the scenes who developed the data, put together the graphics, and made it all understandable.
I’ll give my take on what this means next week; suffice it to say that this is:
- great news for employers and taxpayers,
- bad news for case management and other claims-centric businesses, and
- going to force insurers to think very carefully about future capital investments.
There is a wealth of information in the presentation, SSDI and work comp, residual markets, BLS v WC claim rates – download it here.


Joe, sorry to be picky here, but I come from a state with a competitive state fund. The question is this: in NCCI-serviced states with competitive state funds, are those state funds also excluded from the data, or are they included?
Hi Mike – in general those state funds’ data is included. Check the specific slide for details on each datapoint. link is in the last line of the post above.